Category: ArcGIS Online

  • Enabling Rapid ArcGIS User Onboarding

    Enabling Rapid ArcGIS User Onboarding

    Onboarding new ArcGIS users can be a time-consuming process. Between account setup, permissions, and group assignments, the process often requires input from an administrator, which can cause delays. For times where agility matters—infrastructure projects, emergency response—these delays can be critical. 

    The ArcGIS Self-Service Onboarding GitHub repository outlines how to deploy a lightweight onboarding site—typically in Azure, though it can be adapted for other platforms. This site allows you to generate a URL (or QR code) that users can visit to onboard themselves into pre-defined groups in your ArcGIS Enterprise or ArcGIS Online organisation. 

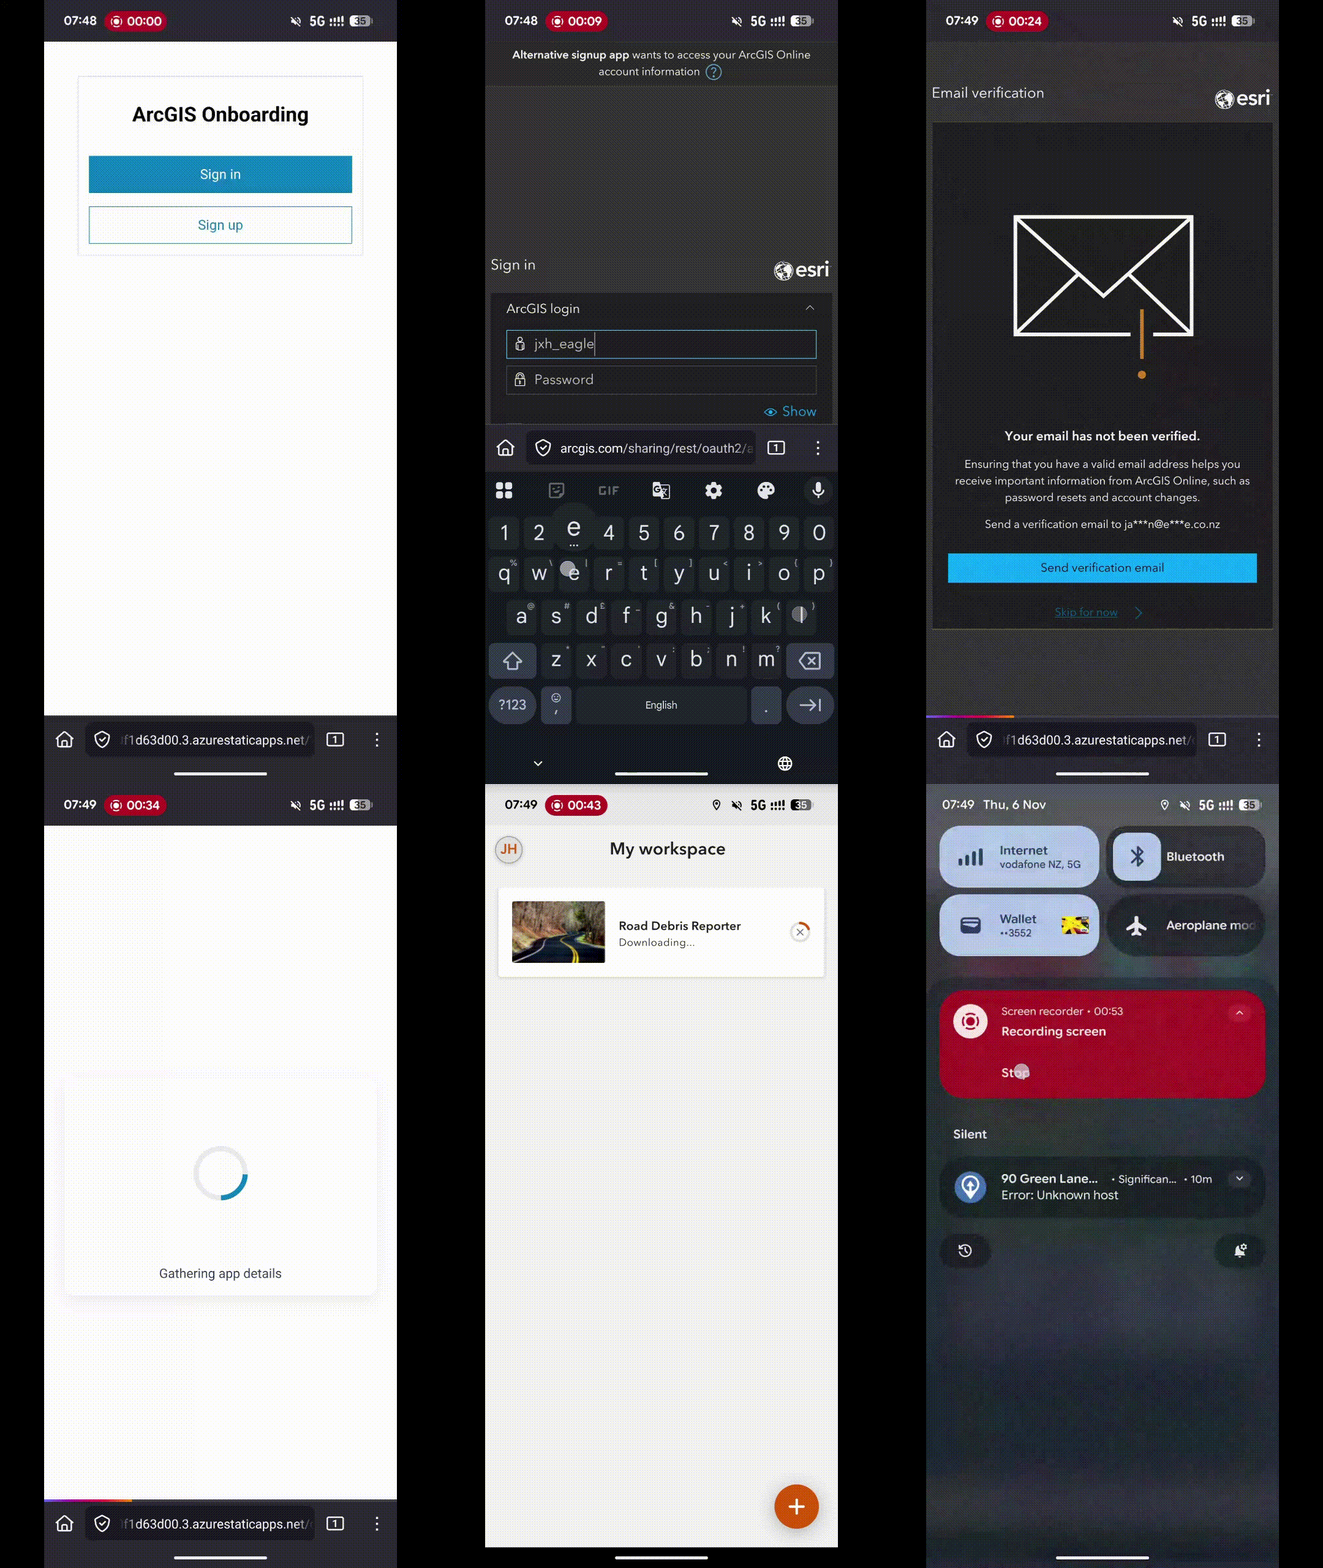
    After scanning the QR code, users sign in with their existing ArcGIS account or (if enabled) create a new one. The site then automatically adds them to the correct ArcGIS Online or ArcGIS Enterprise group and redirects them to a pre-defined URL, which could be an ArcGIS Experience, QuickCapture project, or something else!

    How It Could Be Used 

    • Emergency Response Teams
      During flood or cyclone events, agencies need to onboard additional field staff rapidly. A self-service system means responders can access critical mapping tools immediately, supporting faster decision-making and coordination. 
    • Infrastructure Projects with Multiple Contractors
      Large projects—think roading or water infrastructure—often involve external consultants who need access to shared maps and dashboards. Self-service onboarding ensures these users can join the right collaboration groups quickly, without exposing sensitive data or requiring lengthy email chains. 
    • Regional Council Onboarding Seasonal Staff
      Councils often hire temporary staff for environmental monitoring during summer. Instead of IT manually creating accounts for each contractor, the onboarding portal allows them to self-register, automatically assigning them to the correct ArcGIS Online groups for data collection apps like ArcGIS Survey123. 
  • ArcGIS and Power BI

    ArcGIS and Power BI

    By Jake Hanson – GIS Advisor

    Accessing ArcGIS feature layer attribute data in Power BI using a Custom Data Connector

    Many organisations use ArcGIS for geospatial analytics, visualisation, and data capture, alongside Power BI Desktop, which creates interactive reports and dashboards from a variety of data sources. However, ensuring that users across both platforms work with consistent data and provide uniform reporting to stakeholders can be a significant challenge.

    This post describes how you can compile and configure a Power BI Custom Data Connector to simplify the process of using up-to-date ArcGIS data in your Power BI reports.
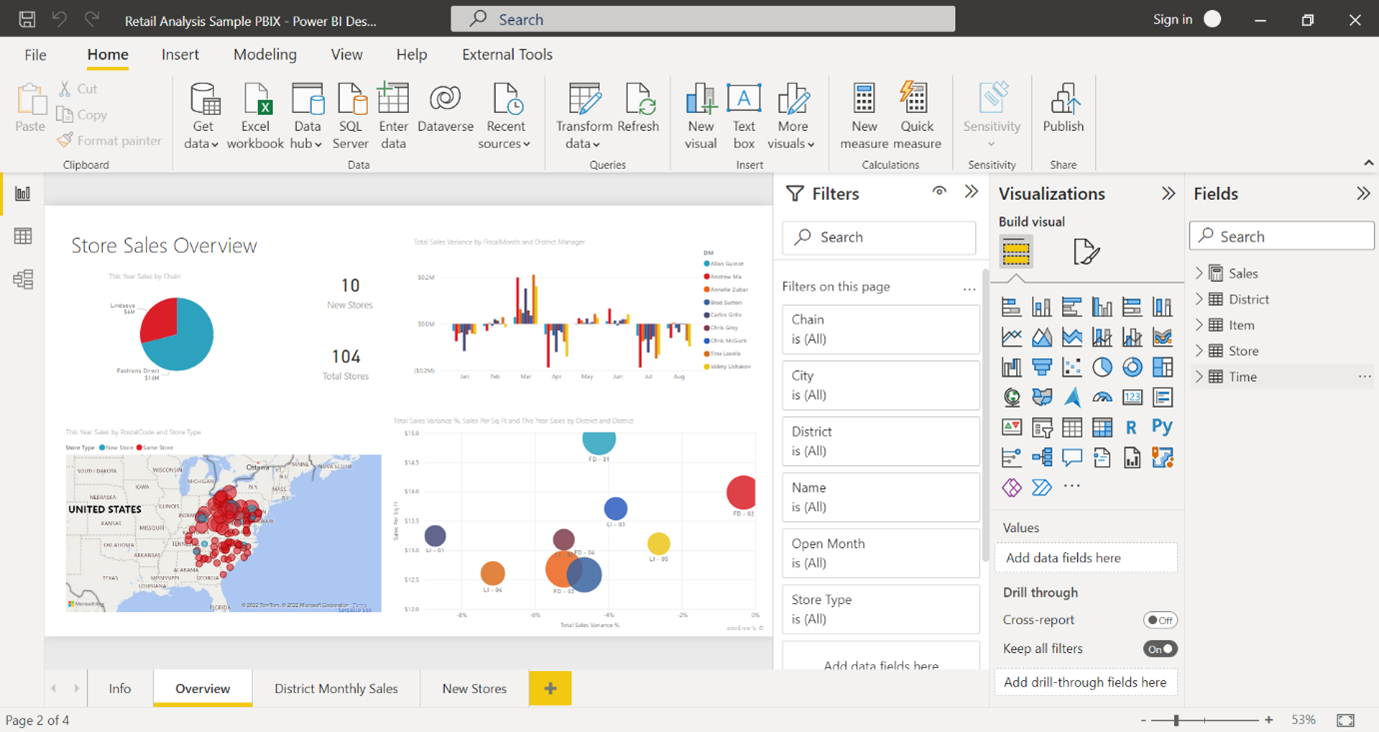
    What is a Custom Data Connector?

    Power BI comes with many data connectors out-of-the-box, for example, allowing you to connect to an Excel Spreadsheet, Parquet, or a SQL Server table. 
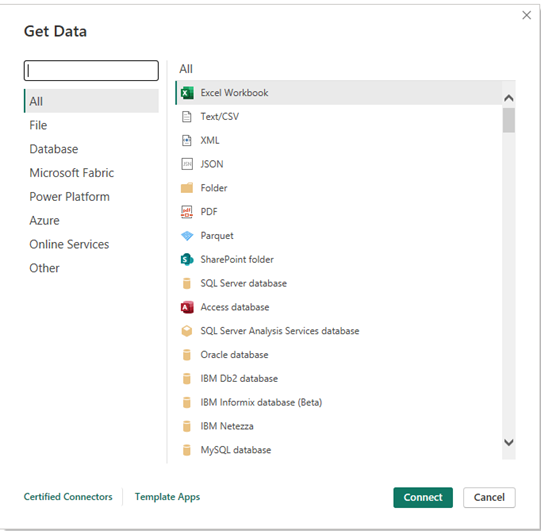
    However, Microsoft also allows you to build your own data connector if your data is in a format that is not natively supported. As there is no native connector for ArcGIS, this post will show you how you can build your own that handles authenticating with ArcGIS, querying a feature layer, paging through the results and loading them into a report.

    When should I use the custom data connector rather than other workflows?

    There are several other documented workflows for bringing your ArcGIS data into Power BI, and each has its own advantages and disadvantages, briefly outlined in the table below:

    Workflow

    Great for

    Limitations

    Using ArcGIS Maps for Power BI to visualise your ArcGIS data within Power BI Desktop

    • Quickly bringing in an ArcGIS map into your Power BI report
    • Doesn’t support analysis of attribute data in Power BI.

    Automating data export to CSV using Power Automate or in bulk with FME or Python

    • Larger ArcGIS datasets
    • Scheduling exports out-of-hours
    • Sharing data with non-ArcGIS users
    • Requires data to be downloaded to a staging area for use

    Directly querying a feature layer using a Web Connection within Power BI Desktop

    • Quickly loading in a small amount of data into Power BI.
    • Only supports small datasets (usually <2000 features).
    • Difficult to refresh the data to get the latest updates

    Using a Power BI Custom Data Connector

    • Seamless – handles authentication, data wrangling for you
    • Refresh data at the click of a button
    • Great for development and testing
    • Users needing to refresh or add new data will need access to ArcGIS accounts
    • Regular requests for tens of thousands of features will have a performance impact on the server.
    • You need to allow non-certified connectors in Power BI Desktop to use custom connectors.

    How would I build a custom data connector?

    Fortunately, most of the work has already been done for you. This GitHub repository contains the basic code for the connector. There’s a little bit of work needed to configure and compile the connector for the ArcGIS Online organisation or ArcGIS Enterprise instance which contains the feature layer(s) you want to access. The steps for this are outlined below.

    How do I configure and compile the connector?

    1. The first step is to install Visual Studio Code, a free text editor and Integrated Development Environment (IDE) with powerful built-in tools, including tools to compile Power BI Data Connectors.

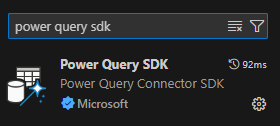
    2. Follow this guide to install the Power Query SDK Extension for Visual Studio Code.
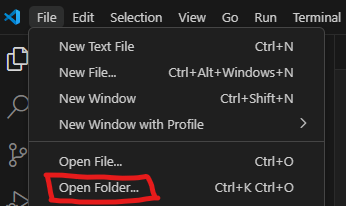
    3. Download this GitHub repository by clicking on the green “Code” button and “Download as zip”. Unzip the compressed folder, then open the folder in Visual Studio Code.
    4. The next step is to register an App in ArcGIS Online or Portal (wherever the data is that you want to access). This will create a Client ID and Secret that will be used to allow the Data Connector to authenticate with ArcGIS. 

    a. Go to My Content > New Item > Application 
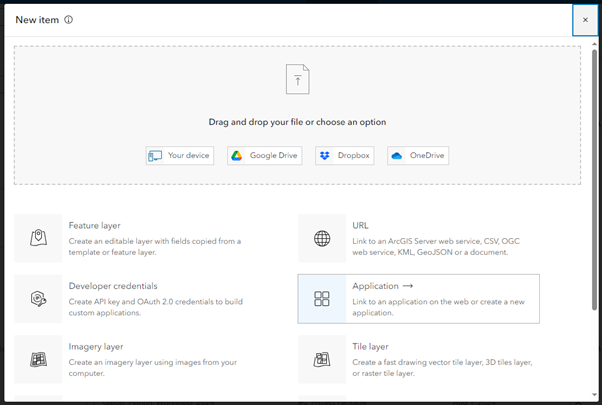
    b. Create an application of type “Other application” 

    c. Name it Power BI Desktop.

    5. In the page that opens, click Settings

    6. In the URL box add https://localhost.local
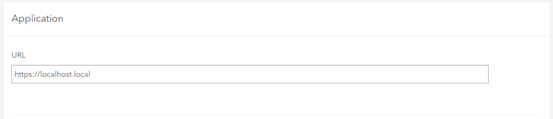
    7. Scroll down and add https://oauth.powerbi.com/views/oauthredirect.html to the Redirect URI box. 
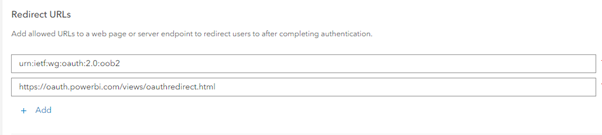
    Click Add, then Save to complete the app registration process.

    8. Scroll to the Credentials section and copy the Client ID. In Visual Studio Code, paste it (overwriting the existing text) into the client_id.config file.
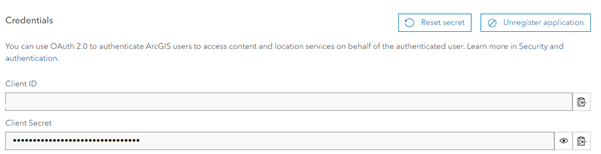
    9. Update the client_portal.config file in the cloned repository to your ArcGIS Online or Portal URL.

    10. In the connector_name.config file, update the file to reflect the name of the environment (e.g. ArcGIS Online Feature Layer or Eagle Enterprise PROD Feature Layer) so that users know which Portal’s feature layers they can connect to using this connector.

    11. Now we have finished configuring the connector, we can compile it into a Power BI Connector. Press F1 and type “Build Task”. Select the Tasks: Run Build Task option.

    12. Select “Build project using MakePQX”. This will build the Connector and store it as a .mez file in the unzipped folder’s ‘…/bin/AnyCPU/Debug’ folder.

    I’ve compiled the connector, how do I install it?

    1. Create the folder C:\Users\<user>\Documents\Power BI Desktop\Custom Connectors if it doesn’t already exist.

    2. Copy the .mez file from <unzipped folder>/bin/AnyCPU/Debug into the new ‘Custom Connectors’ folder.

    NOTE: While it is possible for multiple users to use the same .mez file (i.e. an administrator could create and share a .mez file and associated Portal item with all organisation members), the client ID and secret are easily accessible in plain text in the .mez file, meaning there is a possible risk that a knowledgeable user could re-use these credentials to impersonate your application.

    How do I use the connector once it is installed?

    1. In Power BI, under Options and Settings > Options > Security, enable non-certified connectors. Microsoft certifies a limited subset of custom connectors, but as we are building this one on-the-fly, the connector you create will not be certified. 
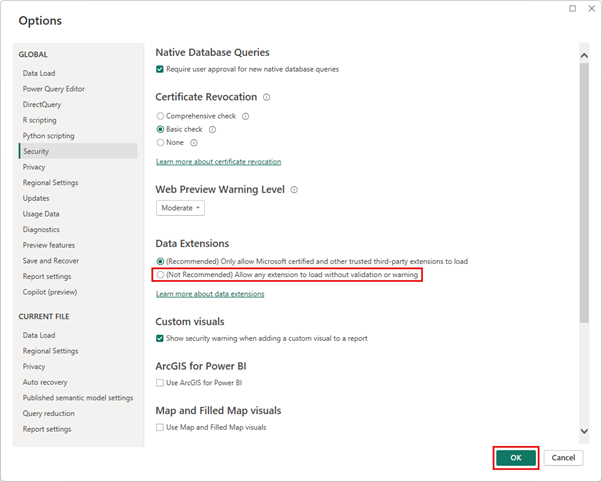
    2.  Now you’re ready to use the connector to add ArcGIS data into Power BI. Under the Home tab in your report, click Get data, click ‘More…’ at the bottom of the menu, and Search for “ArcGIS”. Your connector should appear in the list. Click it then click “Connect”
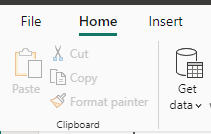
    NOTE: If you don’t see the Custom Connector in the list, it may be because the version of Power BI being used has been downloaded from the Microsoft Store. It is recommended that Power BI be downloaded directly from the official Power BI Website: https://www.microsoft.com/en-nz/power-platform/products/power-bi/desktop

    3.  Enter the URL for the Feature Layer you want to add to your Power BI model, ideally suffixed with a compliant query (filter) as described in the Query documentation.
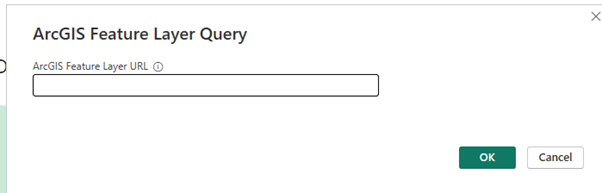

    NOTE: It is highly recommended to use a query to remove any records you don’t need to use in your report to reduce the load on the ArcGIS server. Example: Only the features with an OBJECTID less than 1000 will be returned. https://services.arcgis.com/hMYNkrKaydBeWRXE/ArcGIS/rest/services/Addresses_geocoded/FeatureServer/0/query?f=json&outFields=”*”&where=OBJECTID<1000&returnGeometry=false

    NOTE: If you provide a feature layer URL without a query, which will look like this: https://services.arcgis.com/hMYNkrKaydBeWRXE/ArcGIS/rest/services/Addresses_geocoded/FeatureServer/0/query?f=json&outFields=””*””&where=1=1&returnGeometry=false
     
    NOTE: If you provide a feature layer URL without a query, which will look like this:
    https://services.arcgis.com/hMYNkrKaydBeWRXE/ArcGIS/rest/services/Addresses_geocoded/FeatureServer/0
    The default query below will be used, to request all the features: query ?f=json&outFields=””*””&where=1=1&returnGeometry=false 

    NOTE: The geometry is never returned by the connector.

    4.  Click OK, then click Sign in. This will prompt you to sign in with your ArcGIS credentials. Once signed in, click Connect to load your data into your Power BI report.
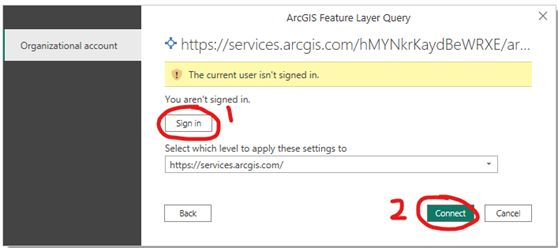
    Now you should see your ArcGIS data in Power BI!

    When you hit the Refresh Data button, the connector should handle the authentication and pull in the latest data from ArcGIS! If you are signed out, the dialog above will display. Simply click “Sign in” again to reconnect to ArcGIS. 

  • How do I off board members in ArcGIS Online? Tertiary Education Institution Focus.

    How do I off board members in ArcGIS Online? Tertiary Education Institution Focus.

    Any Tertiary Education Institution that uses an ArcGIS Online subscription will need to implement a plan for managing their content and membership.

    As your education institution increasingly relies on ArcGIS Online for teaching and research mapping and geospatial needs, it’s vital to establish a robust plan to ensure efficiency, continuity and easy offboarding processes for students and staff.

    Establish a Data Governance Plan

    This robust plan is often referred to as a data governance plan for your education institutions ArcGIS Online subscription.

    What is Data Governance?

    Data governance is about setting institution-wide standards – data policies – that apply to how data is gathered, stored, accessed, processed, and disposed of.

    Why have a Data Governance Plan?

    A data governance plan for managing an ArcGIS Online subscription can help you plan for increased use of your ArcGIS Online subscription and avoid problems.

    What should be addressed in a data governance plan for an ArcGIS Online Subscription?

    • Monitoring utilisation of ArcGIS Online
    • Handling of user content when a student or staff member leaves your institution
    • Regularly informing users of your data governance plan and how it will impact them

    In developing a data governance plan for ArcGIS Online, a good starting point can be to review any existing data governance practices you might have for other systems, and mirror those. Answer questions such as “How often is data purged?”, “What happens to existing content when a user leaves?”, etc.

    Consider including in your data governance plan a statement about when content will be deleted. For example, Content will be deleted when the owner has not logged in during the last 2-years and no one has viewed the content in the last 3-years. This statement will differ between education institutions. You might want to check with your educational institutions ethics people, before adding this statement, to see what the general policy is about keeping students work.

    Monitoring utilisation of ArcGIS Online

    The ArcGIS Online Usage Reports (Organization>Status) are a good place to start. They provide easy access to total usage data. Further analysis and efforts may be needed to provide information for ongoing, repeat usage, as well as daily reporting. Check out the GIS for Everyone (…and how to build your own ArcGIS Dashboard to show it!) blog for an example of how to implement further analysis of an ArcGIS Online subscription.

    Offboarding users

    Ensure that proper messaging is in place when off-boarding members of your ArcGIS Online subscription. Proactively remind members – before they leave – about their options for transferring content, and what happens to their content after they leave.

    Some options that you might like to give your members who are leaving your subscription are:

    • Transferring their content to another member of your ArcGIS Online subscription
    • Transferring their content to an ArcGIS for Personal Use subscription
    • Transferring their content to another ArcGIS Online organisation – only applies if the person leaving your education institutions is shifting to an organisation that has an existing ArcGIS Online subscription.
    • Deleting their own content

    We encourage you to empower your users to take care of the offboarding process as much as possible.

    Some tools that are useful for offboarding members are listed below:

    • ArcGIS Assistant developed by a team from Esri Professional Services, this tool is not supported by Esri or Eagle Technology. This tool can be utilised by any member of an ArcGIS Online subscription.
    • Admin Tools for ArcGIS Online by GEO Jobe GIS Consulting. This tool can only be utilised by a user who has the role of Administrator in your ArcGIS Online subscription.

    Communication

    Members of your ArcGIS Online subscription will not implement their part of the data governance plan if they don’t know about it. Therefore, you will need to ensure that the members of your ArcGIS Online subscription are regularly reminded about the plan. So, use the different communication channels within your education institutions to widely distribute the plan amongst your users. Do not forget to include the data governance plan when onboarding new members to your ArcGIS Online subscription.

    In conclusion, a robust data governance plan is essential for managing members and content in an ArcGIS Online subscription. It helps you monitor usage and handle offboarding smoothly.

    If you need further assistance with a data governance plan for your ArcGIS Online subscription, please contact your Eagle Technology Account Manager.

  • How do I estimate ArcGIS Online credit usage?

    How do I estimate ArcGIS Online credit usage?

    Learn some tips and tricks about how you can monitor credit usage for different activities across your ArcGIS Online organisation including individual member usage.

    Purpose of ArcGIS Online Credits

    ArcGIS Online credits are a form of currency used across the different ArcGIS products. These are consumed on specific transactions (e.g., Analysis Tools) and storing specific features. However, most activities in ArcGIS Online do not use credits (e.g., adding layers from the Living Atlas into a web map).

    Usage of Credits

    Credits in ArcGIS Online are consumed when there is a transaction-based tool being used. These include:

    • Performing Spatial Analysis Tools
    • Performing Imagery Analysis
    • Geocoding Points

    Furthermore, credits are used for storage. There are three types of storage that consume credits:

    • Feature Storage (such as feature layers hosted in ArcGIS Online)
    • Imagery Storage
    • File Storage (such as attachments in the hosted feature layer, files, and other layers)

    As an Administrator of an ArcGIS Online subscription, you want to keep track of the use of credits within your organisation. By monitoring credit usage, you can determine if it is necessary to:

    • reduce data storage,
    • reduce credit consumption,
    • plan for purchasing credits if required. 

    As an ArcGIS Online user, you can estimate the ArcGIS Online credits it would take to perform a transaction-based activity or to store specific data. This would benefit your organisation by ensuring credits are utilised to their full value.

    Estimating credit usage for performing analysis tools

    In the February 2023 ArcGIS Online update, there is a tool that allows an ArcGIS Online user to estimate the approximate number of credits needed to perform spatial analysis.

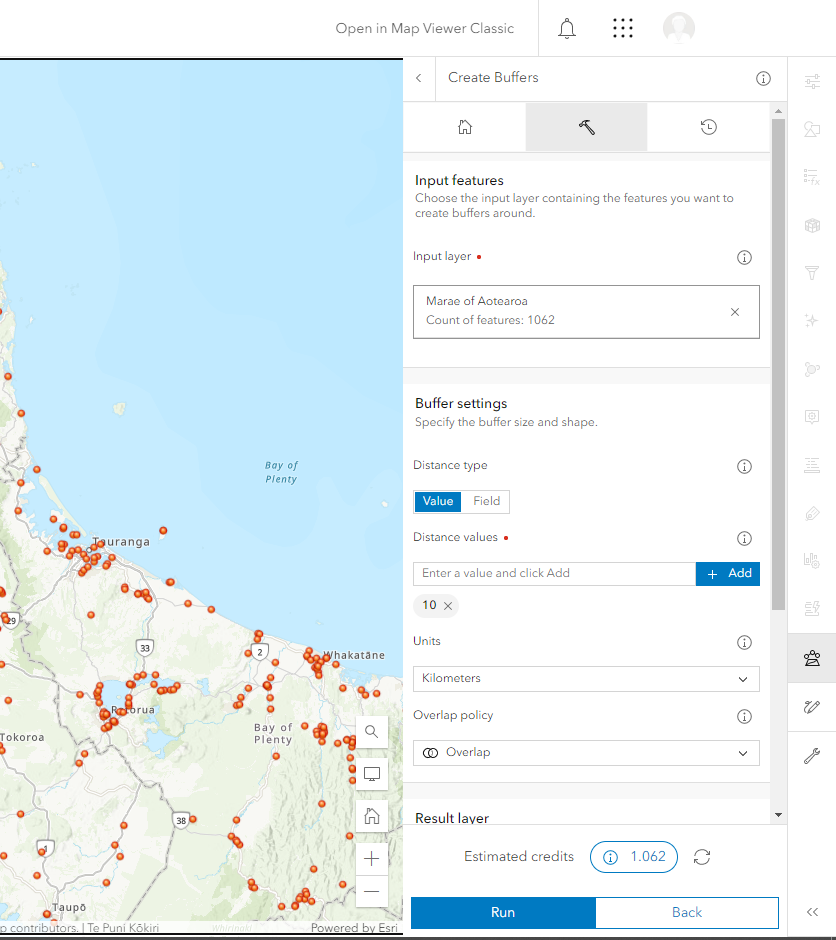
    Example: The Buffer Tool was used to create a 10km Buffer of each Marae in New Zealand (Data by Te Puni Kōkiri). It is estimated that 1.062 credits will be used to perform this analysis for all Marae across New Zealand.

    ArcGIS Online interface of Marae points in the North Island while using the Buffer Tool

    If you would like to reduce credit usage for a specific tool, you can limit the extent of your analysis to the map extent on your screen. This can be done using the display extent option in the environment settings of the buffer tool.

    ArcGIS Online Administrator – the February 2023 ArcGIS Online release does not allow you to change the default analysis extent globally to be the display extent.

    Estimating credit usage for storage

    As of April 2023, the feature storage charge cost is 2.4 credits per 10 MB stored per month and is calculated hourly.

    You can check the latest information about credit usage costs at the Esri ArcGIS Online site under ‘Credits by capability.’

    An ArcGIS Online Administrator can estimate the use of credits for storing features.

    Estimation Methodology

    As an Administrator, this methodology could help determine the number of credits used to store certain files.

    Example: This ArcGIS Online subscription has about 41.47 GB of feature storage. However, the cost of credits changes each day in the months of January and February in the new year.

    • Convert the Gigabyte (GB) to Megabyte (MB). Remember that 1GB = 1024 MB

    This equates to ~42465 MB

    • Calculate 2.4 credits per 10MB Stored each month.

    Divide the total of Megabyte by 10 = 4246.5

    • Multiplied by 2.4 credits per month for feature storage.

    This would be about 10,191.6 credits per month.

    • Results of Credit usage in months with different number of days

    Divide the total amount of credits per month to the number of days in the month.

    • January (31 days) = ~328 credits per day
    • February (28 days) = ~363 credits per day

    Credits are charged at a monthly rate; this means that the cost of credits differs each month. Therefore, the number of days per month impacts the cost of credits, even though the data size remains the same.

    Other resources

    Esri has additional resources available to explain ArcGIS Online credits.

    ArcGIS Online Credits – Storage (Video)
    Esri ArcGIS Online Credits (Web)
    Understanding credits (Help Page)

    If you need further assistance with understanding ArcGIS Online credits and their use, please contact your Eagle Technology Account Manager.