
Tag: ArcGIS

  • How Auckland Council Uses Digital Twins for Infrastructure Planning

    How Auckland Council Uses Digital Twins for Infrastructure Planning

    Digital twin technology is transforming how New Zealand’s councils plan, manage, and maintain critical infrastructure. By creating real time 3D replicas of physical assets — from water networks to road surfaces — councils gain unprecedented visibility into the condition and performance of their infrastructure.

    The Challenge

    Auckland Council manages over $30 billion in infrastructure assets across the region. Traditional asset management relied on periodic inspections, spreadsheets, and disconnected systems — making it difficult to prioritise maintenance, forecast renewals, or respond quickly to failures.

    The Approach

    Working with Eagle Technology, the council implemented an ArcGIS-based digital twin that integrates IoT sensor data, LiDAR surveys, and existing asset registers into a unified 3D environment. The platform connects real-time data feeds with historical records, enabling predictive maintenance and scenario planning.

    “The digital twin gives us a single source of truth for infrastructure condition. We can now visualise, analyse, and plan in ways that were simply not possible before.”
    — David Thompson, Asset Manager, Auckland Council

    Key Outcomes

    Within the first year, the council reported a 30% reduction in unplanned maintenance events, 20% improvement in capital planning accuracy, and significantly faster response times to infrastructure failures. The platform also improved cross-departmental collaboration by providing a shared spatial view of all city assets.

    Looking Ahead

    The council is now exploring AI-powered anomaly detection and predictive analytics to further optimise infrastructure lifecycle management. Eagle Technology continues to support the programme with managed cloud services and ongoing GIS consulting.

  • ArcGIS Utility Network Video Series

    ArcGIS Utility Network Video Series

    Technology is evolving at a rapid pace and is changing the way that utilities operate, manage, build and maintain resilient networks. Changing technologies coupled with the uptake of renewables, disruptive events and rapidly changing weather patterns all affect the way that utilities are able to respond and react.  Underpinning all of this is maintaining an accurate digital twin of a utility network that can be used to aid responses quickly as situations change out in the field.     

    The ArcGIS Utility Network is a comprehensive framework for modeling your network assets in greater detail than ever before. The Utility Network incorporates robust business rules and connectivity logic to accurately represent your network as it is installed above, on, or under the ground. Your GIS features are accessed securely through web services, granting access to the Utility Network from any device, anywhere, at any time. Your users gain insight by leveraging enhanced analytic capabilities such as performing network traces and generating schematic diagrams to enable stakeholders to better understand the status of the network in real-time to make better informed operational decisions.     

    We are pleased to announce the release of our series of informative videos aimed at NZ utilities – whether they be in the electric, gas, water or telco industry domains.    The video series will be initially covering topics including:   

    You can find the video series on Eagle Technology’s YouTube channel   

    For any questions or enquiries on how the ArcGIS Utility Network can benefit your organisation, please feel free to contact us at utilities@eagle.co.nz. 

  • Behind the Scenes of Election17

    Behind the Scenes of Election17

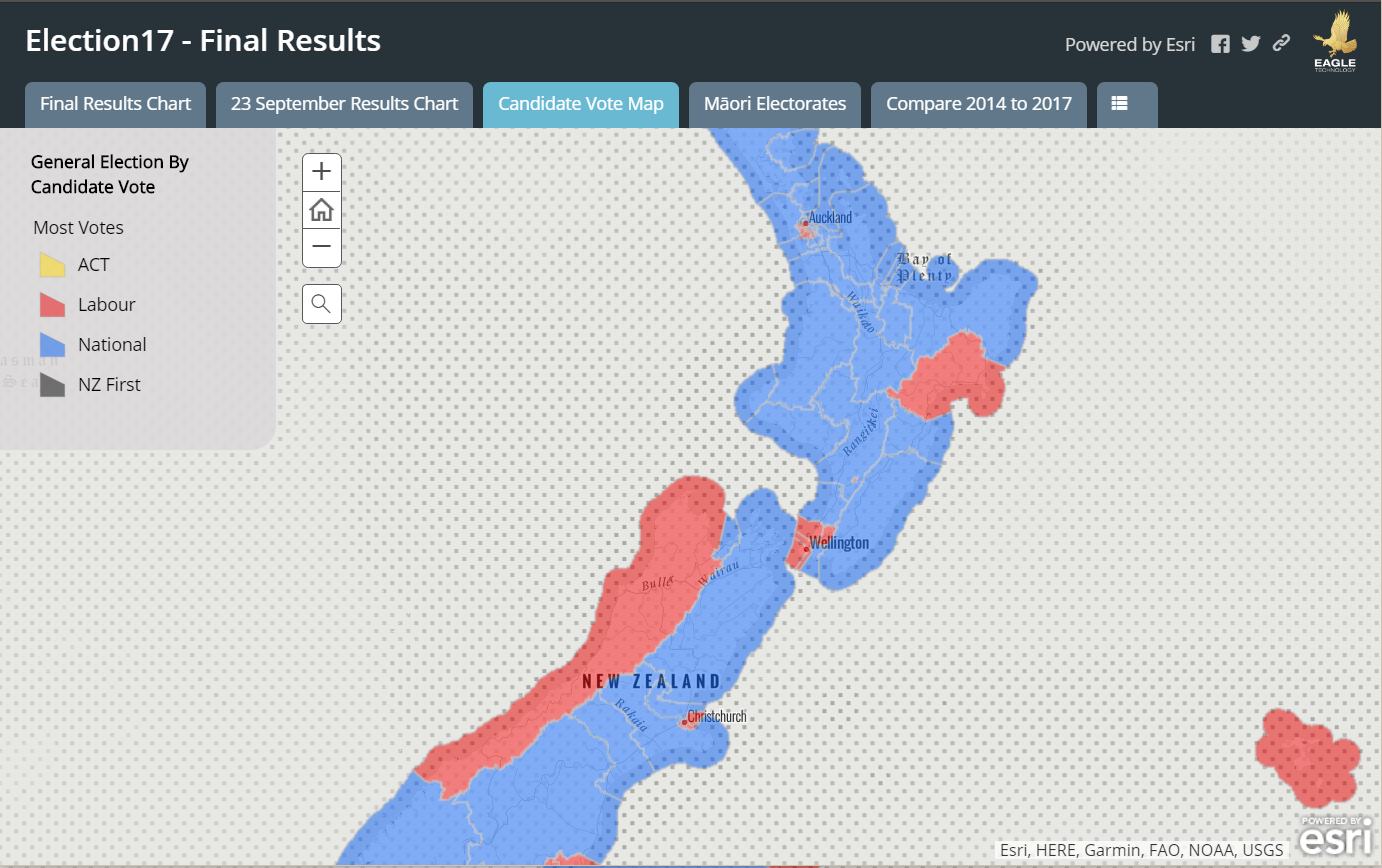
    This year Eagle Technology partnered with Radio New Zealand for the Election17 coverage, producing their live-updating election maps on the night. This blog post will reveal the technical tips and tricks behind how these maps were made.

    What we had to work with? The Electoral Commission released their results for the 2017 Election publicly in xml format.

    So how do we take this data and transform it into colour changing and winner naming maps?

    To do this we used a combination of FME, ArcGIS online and arcade expressions. These were used for the following workflow;

    XML to ArcGIS Online hosted feature layer

    The election results were available to us in xml. FME was used to convert this xml feed into two ArcGIS Online Hosted Feature Layers (Polygons of the General Electorates, and Māori Electorates) and an ArcGIS Online table.

    From these Feature Layers we could create various Web Maps and Web Apps on ArcGIS Online. The main product on the night was a Storymap which included a graph of the live party votes for all electorates and main centres.

    Arcade Expressions

    Arcade is the secret behind what made our maps perform and appear well on the night. This language was used throughout for the customization of the popups and symbology of the electorates. Examples of some tasks arcade allowed us to do were;

    • Calculate which party or candidate was currently in the lead 
    • Make the popup show the name of the winning party in their party colour
    • Control what candidates show up for an electorate in the popup
    • Show the winning margin between candidates
    • Show the 2nd Place Candidate

    Learnings from this experience

    • When editing symbology on a hosted feature layer which has multiple feature layer views originating from it. try to get the symbology, popups and arcade done on the original feature layer prior to making the views (this will reduce a lot of repetitive tweaking on layers).
    • Having important details like colour hexcodes on standby is really useful for the amount of times you have to copy and paste!
    • Take care while creating maps with feature views . Do not “Save Layer” and over write the layer settings (i.e.symbology and for a brief monent make the whole map purple. Creating a new view for this sort of testing is advised as best practice.

    Overall this was an incredible opportunity for the Interns to use our knowledge gained over the last few months, and work on a high-profile project alongside other members of the Eagle Technology Technical Team.

    Our storymaps from the night are still live (with special votes), and can be viewed here: http://eaglegis.maps.arcgis.com/apps/MapSeries/index.html?appid=bfe1903e…