Tag: GIS

  • Careers in GIS

    Careers in GIS

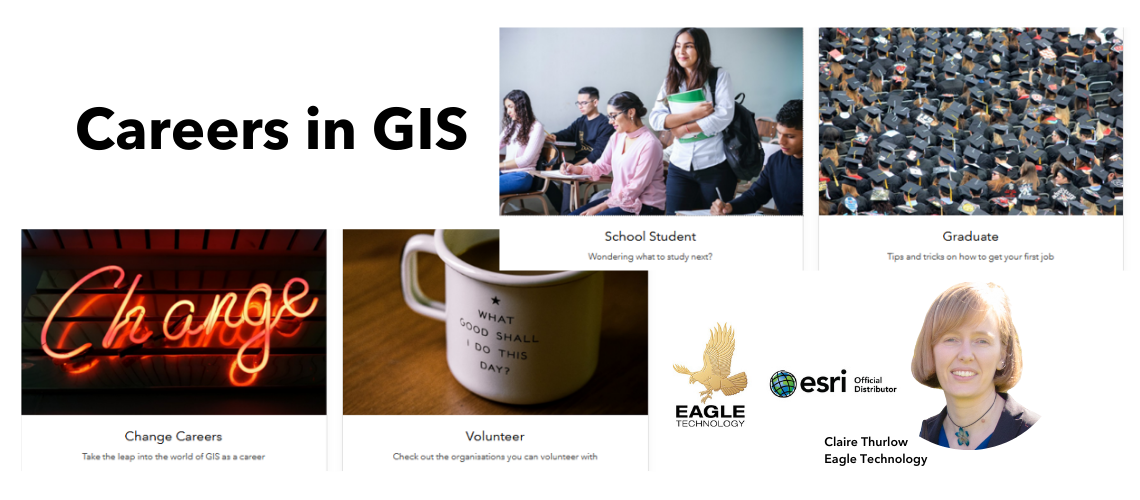
    At the New Zealand Esri User Conference 2022 during the Growing GIS People session, we launched a new industry initiative entitled Careers in GIS. The central idea for this initiative is to enable the community to have a Hub that sells GIS as a Career to people who fall into four main personas:

    • School students – targeting juniors at high school who are trying to make their subject choices but also seniors who are trying to decide what courses to take at a tertiary provider
    • Graduates – targeting early talent, people just finishing their tertiary education study and looking to launch into the workforce, could include links to organisations’ intern and graduate programmes.
    • Career Changers – information for people who are looking to change their career after being in the workforce for some time
    • Volunteers – people looking to get some work experience in GIS or just wanting to make a difference in their communities using GIS, this information might include links to volunteer organisations that use GIS e.g. GIC

    The personas would be prominently displayed on the front page of the hub and each persona would have a subpage with content to help that persona progress. For example, the school student sub page might have some of the following:

    • Videos of people talking about what they do in their job and how they use GIS as part of that job
    • Recommendations on what subjects to study at school and tertiary education providers
    • Links to tertiary education providers who have GIS papers or programmes

    The Careers in GIS hub would be hosted by Eagle Technology, but we envision the NZ Esri User Community would be contributing to the content of the hub.

    Call to action – at NZEUC 2022 we asked people to submit their name via the following survey123 form and add a comment around how they would like to help with this initiative. We are now extending this call to action to the wider NZ Esri User Community. So please submit your details and ideas about how you can contribute here

  • Mitigating the risks of climate change

    Mitigating the risks of climate change

    “NIWA uses GIS to map and interpret modeled climate change projections over New Zealand and provides these to a range of end-users, for example, regional councils, industry, and other researchers. These maps allow decision-makers to understand potential future changes in climate at a high resolution across New Zealand and make planning decisions accordingly.” – Petra Pearce, Manager – Climate, Atmosphere & Hazards at NIWA.

    Events such as the Australian wildfires at the beginning of this year brought climate change to the forefront of the public consciousness. Record-breaking temperatures and severe drought provided the ideal conditions for wildfires to establish themselves. In a local, albeit less extreme example, the Auckland drought this year is one of the severest droughts in modern times. According to NIWA regional climate models, such climatic patterns will be expected in higher frequencies over the course of this century.

    Although the future may seem grim, science and technology can still guide us toward a better understanding of climate change and ultimately, the development of mitigation strategies against its impacts. Mapping environmental problems is crucial to establishing a link between the state of the climate and potential causes, and technology serves both as a powerful tool to examine climate change as well as to educate the public on its significant risks.

    Geographic Information Systems (GIS) provides the framework in which we can collect, analyse, and manage geographic information. Most data are inherently spatial, and climate change data is no different.

    Some ways in which researchers leverage GIS to study climate change include locating areas where temperatures significantly deviate from the global average and studying satellite data to monitor land cover changes relevant to changing climates. In New Zealand, key areas of concern include the predicted higher frequencies of extreme events such as floods and droughts, therefore modeling these and understanding how different regions will be affected is crucial to prepare adaptation strategies for the various regional and local governments.

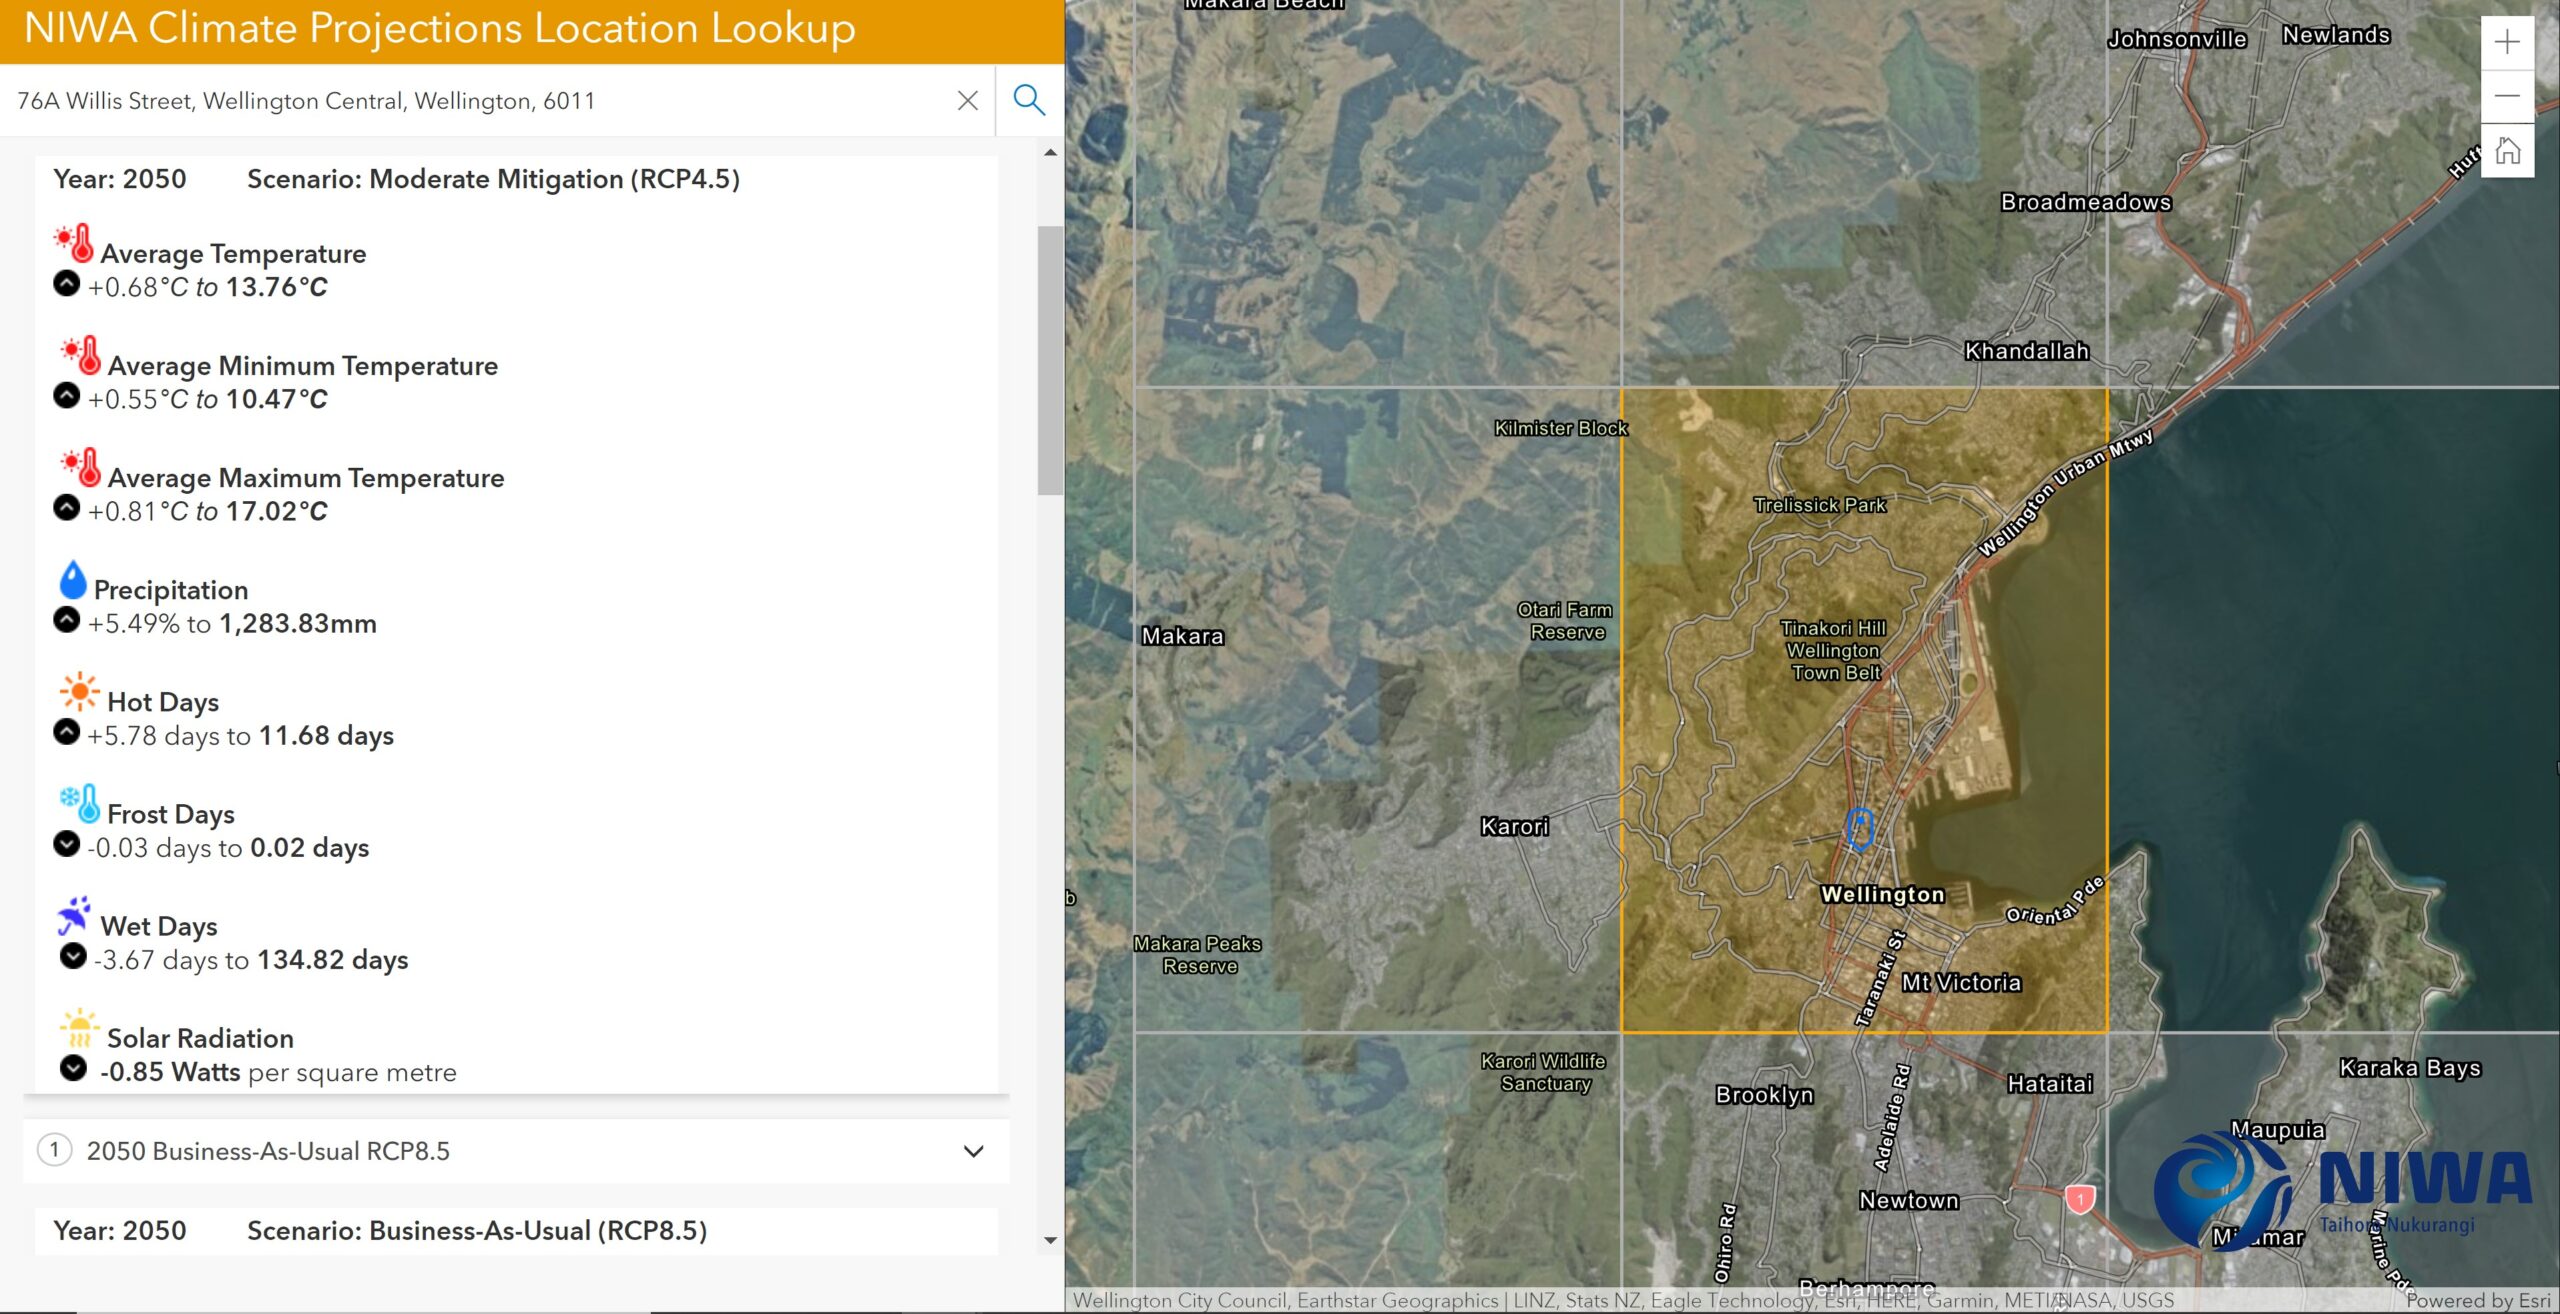
    NIWA’s Climate Change Hub allows users to look up climate change projections for their area

    Results of climate change studies, such as this national flood risk report from the Deep South Challenge, can be used to inform the planning of infrastructure such as roads, bridges, coastal properties, utilities pipes and more. Such knowledge produced by research institutes relies heavily on GIS tools and applications to interpret the data. When extreme events do occur, GIS intelligence and real-time situational awareness maps provide emergency personnel with vital information on which areas require the most urgent attention and can act accordingly.

    In addition to the role that GIS plays in helping researchers to understand climate change and mitigate its risks, GIS tools can generate data visualisations to inform and engage the public in the form of dashboards, interactive maps and apps. Here is a brilliant example of a sea-level rise viewer for Wellington, created by Greater Wellington Regional Council. Theories and articles about climate change can only do so much to influence public perception, so establishing that solid link between the theory and real-life effects through interactive apps is key to engaging with the public.

    The team at Esri recently released a podcast examining the role technology and science play in addressing systemic issues such as climate change. Give it a listen here.

  • Looking through a new lens

    Looking through a new lens

    by BILL BENNETT

    Auckland is on the cusp of an Internet of Things revolution. Sensors are being planted all over to measure and record the city’s heartbeat with 5G mobile technology that will ramp up. Within years there will be millions of devices collecting a constant stream of data. They will measure everything from traffic flow to air quality to noise levels. Data will arrive so fast that conventional tools are not up to interpreting, analysing and putting it into context. Councils and other organisations use geographic information systems (GIS) to make sense of large amounts of data. 

    Eagle Technology’s Greg Price has worked with organisations in the Auckland region to build systems that collect and organise this data in ways that make sense. The key is to tie location-based data to a series of digital maps using Esri technology. 

    “Organisations use a number of different IT systems to manage and analyse data. “Most people are familiar with the idea of financial information systems. That is one lens to look at operations and assets. It will give you one view. Another way to look at data and information is to use a location lens to manage operations and assets. You can also use it to plan and to optimise. 

    “Location is important because things are often the way they are because of where they are. They also have a relation to the things that are around them. This is what GIS brings to any organisation. 

    “Governments, particularly local government is very much about managing places or locations. With most councils, and this would include Auckland Council, 80 percent of what they do is based on location.” 

    For councils and similar organisations GIS is the decision-making tool that pulls the various data strands together. They don’t have to be the same data strands. One of the beauties of a GIS is that it can produce map layers on top of one another. You could overlay a map of say, the city’s road network with air quality information or noise control data. This will identify places where traffic is doing more harm than holding people up as they travel. Planners can use this to improve people’s quality of life.

    “Decision support is one of the main patterns of use with GIS. There are others, among them are: mapping and visualisation; data management; field mobility, that is managing a mobile workforce; along with monitoring assets and resources in real-time or near real-time. 

    “Another important use is analytics. You can use GIS to discover trends and patterns. “If, say, you have a map of where people get hurt on a Friday night in the CBD, you can park an ambulance nearby so they can be treated faster. You might also use this data to change policing patterns.” 

    GIS is also widely used for designing and planning. Price says Singapore uses Esri to optimise its land use. The nation is 720 square kilometres so land is at a premium. The city’s planners have built a digital twin of the city so it can visualise infrastructure and development projects. The model is three dimensional so it can account for the spaces above and below ground level. 

    He says: “One of the more recent applications of the system is for constituent engagement. This is not about pushing maps out to people, that’s been going on for a long time. “Now the system is being used so that people can push information back to the council. It also allows other groups to use council map data. “This might include developers as in Singapore, but it can also include conservation groups interested in protecting a particular area. Another way this can be used is for members of the public to identify where new graffiti has appeared so thatacrew can be sent to clear up.” 

    Price says location-based data gives powerful insights into matters that might otherwise remain invisible to city planners and managers. “A water utility might use GIS to look at where leaks are happening in its pipes. “When the data is shown on a map, it often turns out a pattern emerges. The engineers can then ask what is common about the areas where there are leaks. Those patterns are often more obvious than looking at a table or a chart.” 

    In the past, much of the data used in GIS maps was collected either manually or automated data may have been stored locally and batch-uploaded to central computers. The growth of the Internet of Things and better connectivity means that most data is now collected in real-time. Price says this changes everything. “The pattern analysis can now take place in real time, or near real time. That means you’re not only looking at historic data but can see what is going on now. If necessary you can act immediately. 

    “This also means you have a better idea about what might happen in the near future. In some cases this means you can get your resources in place before things get critical,” he says. 

    In some cases this can be as simple as a small adjustment to a timetable so that passengers arrive at, say, a ferry terminal a few minutes before the boat leaves. 

    Price says a more complex example might be that the roading department knows it will need to lay fresh asphalt in the next few years while the water company knows the water pipes in the same street need replacing and Chorus needs to work on the fibre. GIS lets planners pull these threads together so the work is done in a cost-efficient way that also minimises disruption.

    He says GIS has the ability to share data and coordinate organisations where the links may not be that strong. Joining these systems up can be powerful, especially when coupled with sensors. It’s possible now for a sensor to register there is flood water on a road. Systems can relay this information to traffic management controls. By automatically manipulating traffic flows, the system can route cars around the obstruction without human intervention. 
  • 2017 Esri Regional User Conferences – it’s a Wrap!

    2017 Esri Regional User Conferences – it’s a Wrap!

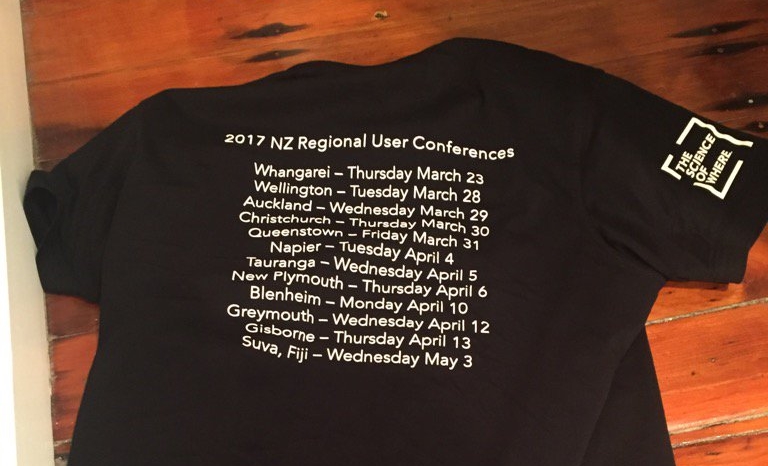
    The Eagle Technology team recently completed the Regional User Conference (RUC) tour covering 11 NZ locations, 1 Fiji location and over 700 delegates.

    We would like to take this opportunity to thank everyone who participated – presenters, organisers, networkers and delegates.  The feedback we’ve received is very positive and the events were a great success.

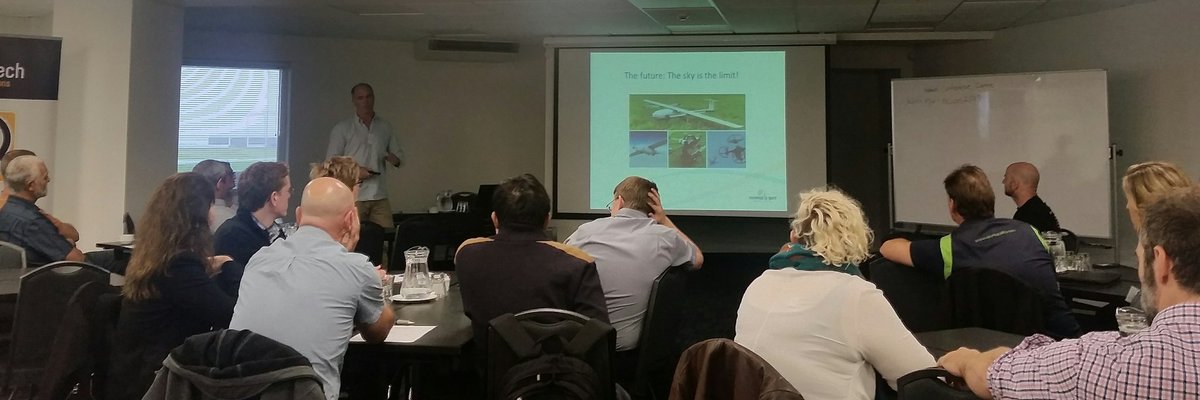
    Napier RUC Event

    Technical Resources
    A lot of technology information was shared at the RUCs, some of which may have been missed. Below is a list of resources you may find useful:

    A selection of videos based on RUC demonstrations including ArcGIS Pro, ArcGIS Online Collaboration, Insights for ArcGIS and others. 

    A Storymap illustrating how Sharing works using ArcGIS Online – a different, but equally interesting example to the one shown at the RUCs.

    A 3D Storymap outlining the benefits of 3D visualisation for Development when planning for growth, designing new developments or reviewing design plans in your community.

    Other Important Announcements

    NZ Basemaps – There is now an easier way to give us your feedback on the NZ Basemaps.  The Feedback App allows you to provide comments and suggestions so that the Eagle team can review and incorporate into upcoming releases.

    Living Atlas – Become part of the Living Atlas and to submit your data to the Esri World Stream Gauges layer.  This layer displays measurements recorded at Stream Gauges around the world and puts them into one convenient service, if you were interested in joining us in creating this across New Zealand please contact GIS Support

    Landsat Explorer Web App – Explore the planet more deeply with the Landsat Explorer web app. Use the app to both visualize our planet and understand how the Earth has changed over time. Now you can instantly analyse more than 500,000 Landsat 8 and GLS scenes, offering global coverage with over 500 new scenes added everyday. The web app is free, with no download or installation required.

    NZEUC 2017 – Call for Papers is open until May 26.  We saw many exciting and interesting presentations at the RUCs and we would like you to submit and share your work with the wider NZ community.  More information about how you can submit your abstract can be found here.

    Esri Training – This year, four RUC locations incorporated a day of Instructor led training pre or post RUC.  If you would like to know more about the training available for you or your organisation, email us or go to Eagle GIS Training.

    Feedback – If there is any other feedback you have about the RUCs please email the NZ Esri User Group or post a comment on the forum.

    We hope you find this additional information useful and we look forward to seeing you and sharing your work at the NZEUC in August.

    The Eagle Technology team

  • Geodesign – Academic roots

    Geodesign – Academic roots

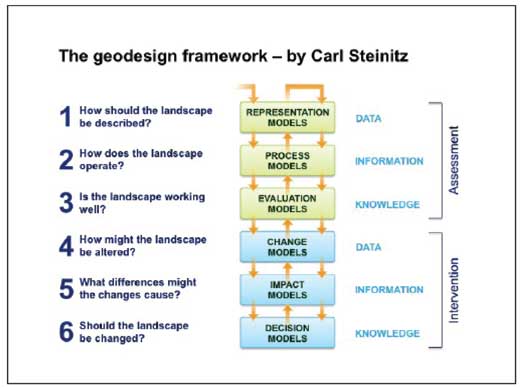
    Ian McHarg was the first to describe the concepts behind geodesign in his seminal ‘Design with Nature’ in 1969.

    Ian McHarg was the first to describe the concepts behind geodesign in his seminal ‘Design with Nature’ in 1969. And proponents like landscape architect Jack Dangermond – the guiding force behind Esri, the world’s leading GIS (geographical information system) developer – have been talking about geodesign as a rigorous discipline in academic journals and conferences for years. But, in practice, automating the process has proven to be problematic.