Category: General Updates

  • NZ Raster Basemaps (Classic) Are Moving to Mature Support

    NZ Raster Basemaps (Classic) Are Moving to Mature Support

    On 5 December 2022, the remaining New Zealand “Classic” Raster Basemaps will be moving to mature support. When basemaps are moved to mature support it means that the items will still be available, but they will no longer receive updates. For this reason, we strongly recommend updating your maps, apps and basemap gallery to use the latest NZ Raster and Vector Basemaps.

    For each NZ Raster Basemap there are two versions available:

    Why two versions of the same basemaps?

    Due to basemap switching compatibility issues with applications such as the 3D Scene Viewer, and Web App Builder we have made our basemap tiling scheme’s uniform and consistent across all NZ raster basemaps and the NZ vector basemaps. Not only will be able to easily switch between and overlay the NZ basemaps, but you can also zoom deeper as the current raster basemaps all allow zooming in to 1:70.  

    Which NZ Raster Basemaps are already in mature support?

    The following raster basemaps moved to mature support at the start of 2022:

    Both the classic and current version are not receiving any more updates. We recommend migrating to the equivalent Vector Basemap. The vector basemaps can be found in ArcGIS Online, ArcGIS Living Atlas and in this group. More information on the NZ Vector Basemaps can be found in this StoryMap.

    Which NZ Raster Basemaps will move to mature support, and which won’t?

    The following raster basemaps will move to mature support from 5 December 2022:

    The current versions of these maps will not be moving to mature support and will continue to be updated.

    If you are using one of these Classic basemaps we encourage you to migrate to the current versions of these maps, that won’t be moving to mature support:

    How can I tell which version of basemap I’m using?

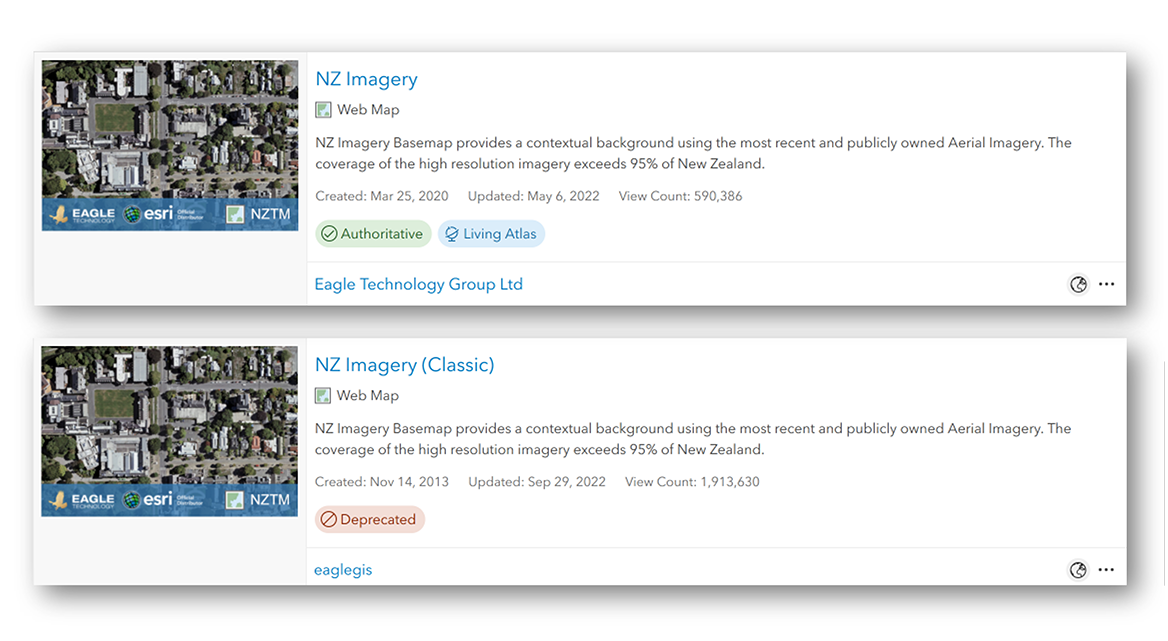
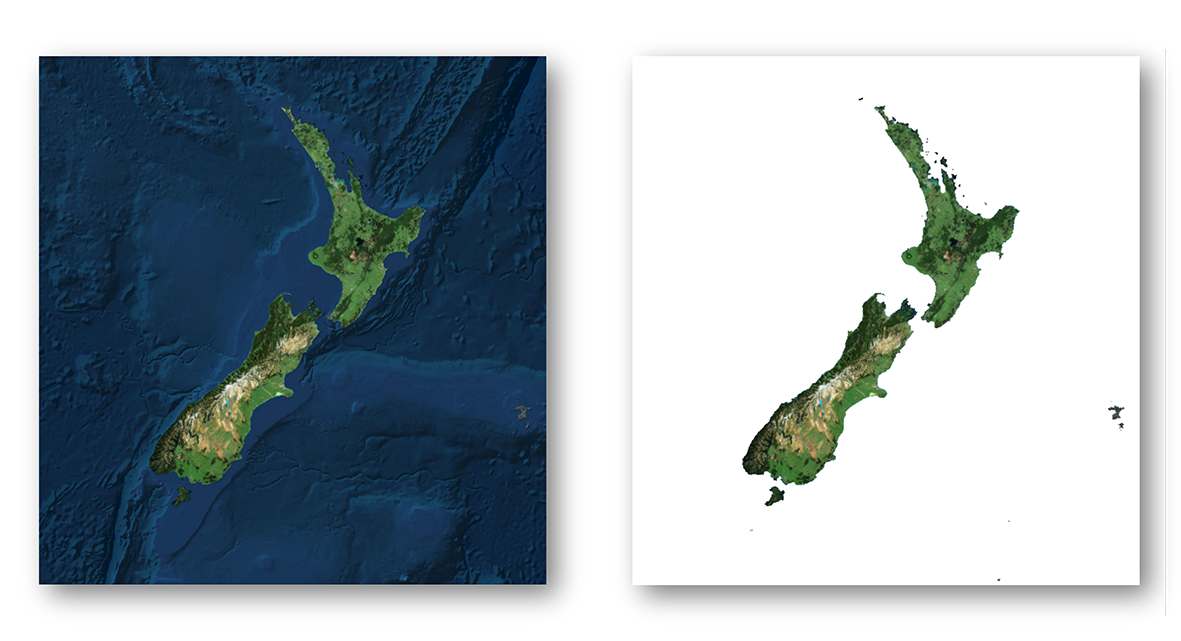
    You can easily identify which NZ Imagery Basemap you’re using by whether blue bathymetry is present. If your basemap is floating in white space, you are using the Classic version and you should migrate. Whereas, if you see blue bathymetry around New Zealand, you’re using the current version.
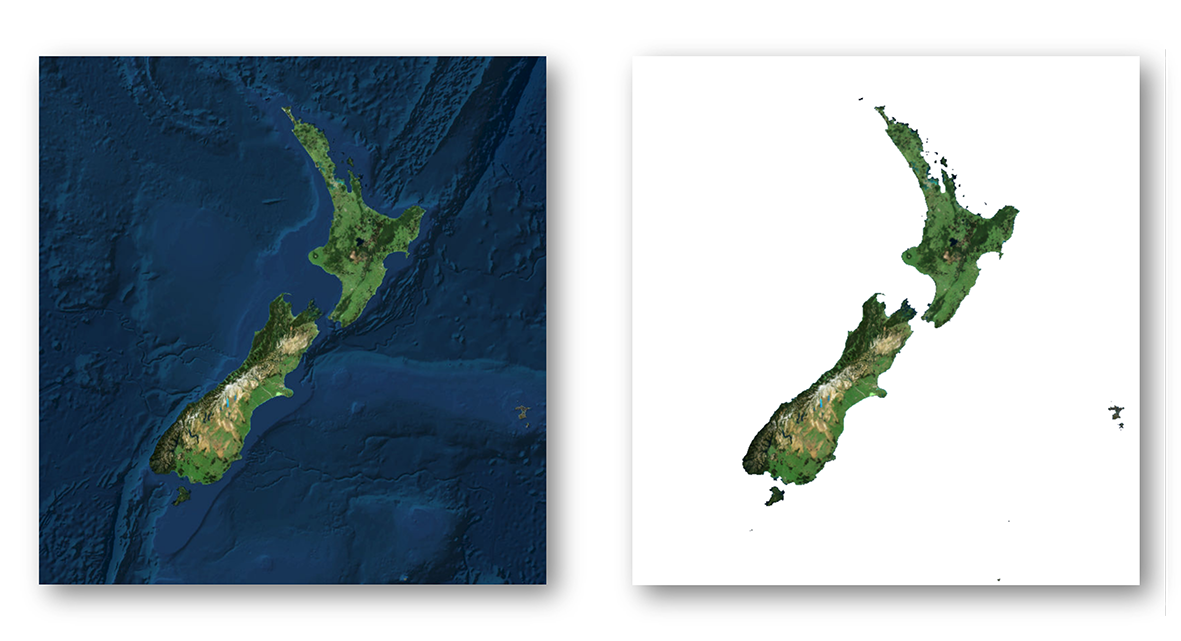
    For other basemaps there are a few ways you can identify if you are using the Classic version. In the web map you can open the properties of the basemap and check if it is using the services1.arcgisonline.co.nz URL.

    While in the app, you can also open the Network Tab in your Browser’s Developer Tools. If you pan the map with the Network Tab open, you can check if any requests are made to services.arcgisonline.co.nz. You can add services.arcgisonline.co.nz to the filter to more easily identify this. If there are requests made to that URL then the app uses basemap in mature support.

    Migrating

    Migrating from the Classic basemaps to the current versions or a vector basemap will in most cases be as simple as switching out the old one for the new one in the Web Map or App. There are situations where some extra care is required. In any case, testing the new basemap before switching is recommended. Here are a few cases where extra care is needed. There may be other situations where extra effort may be needed.

    Your app uses the Scale/Zoom Level ID to zoom to a specific scale or uses url-parameters to zoom to a specific scale

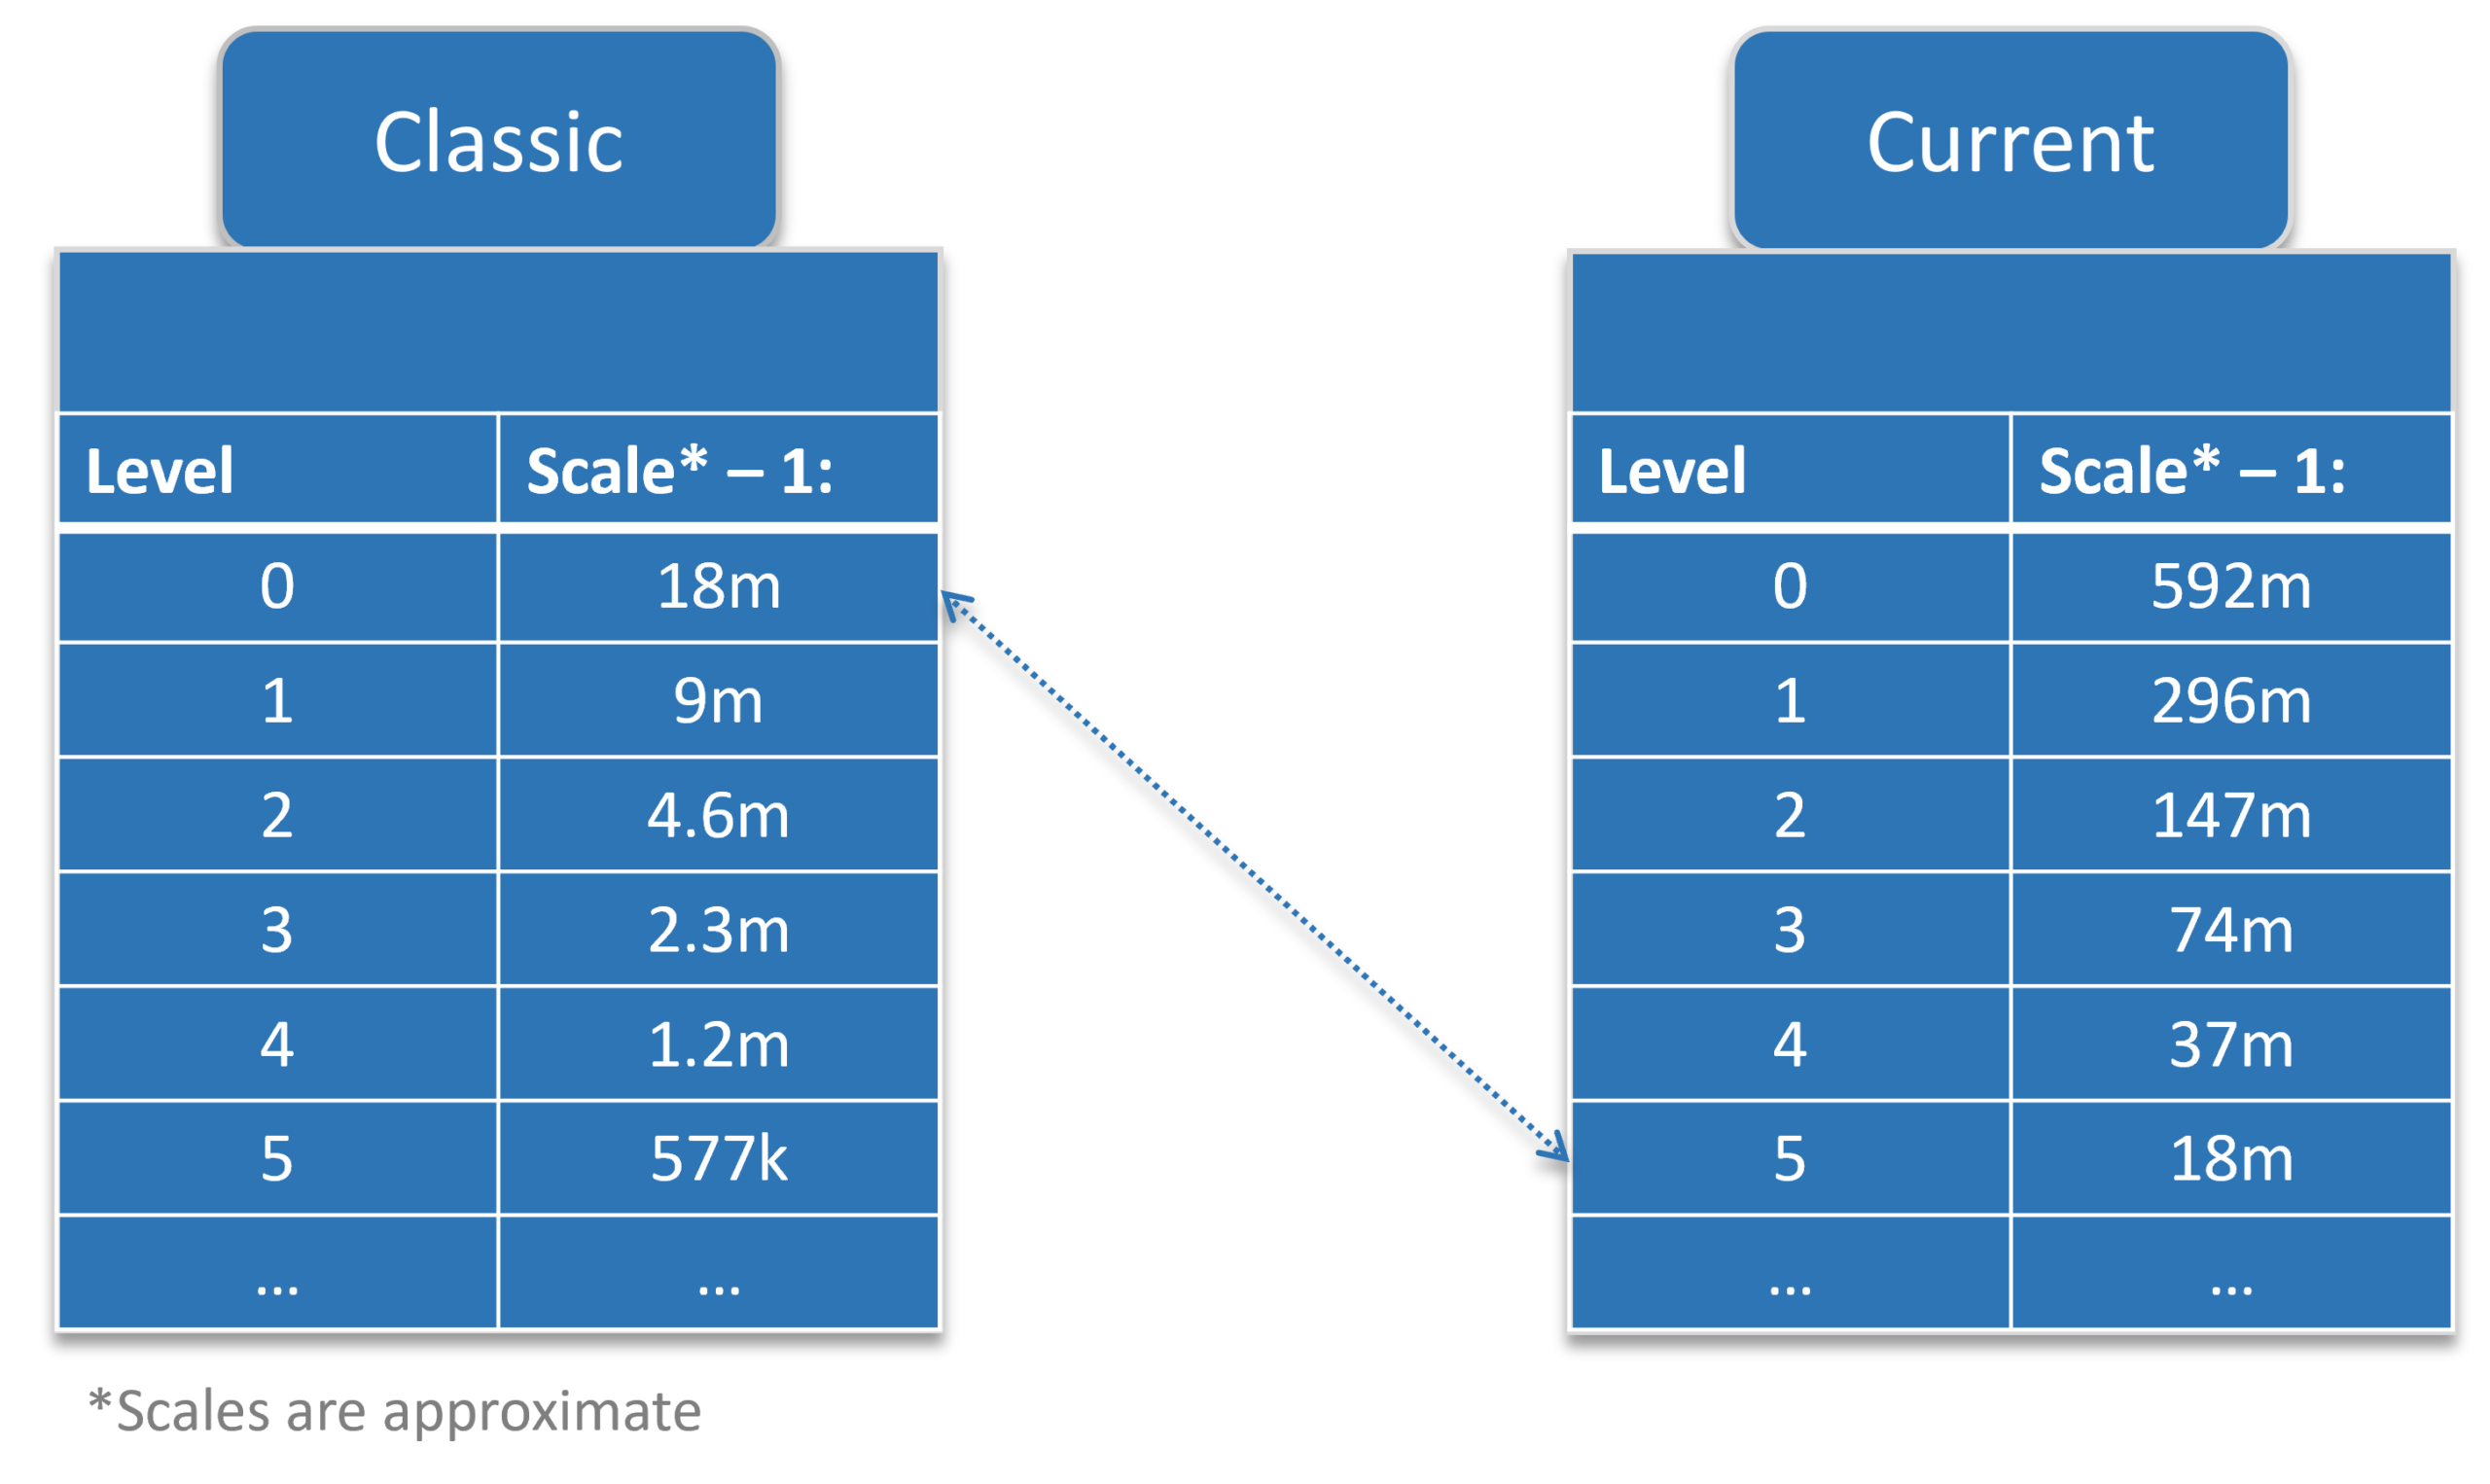
    With the new tiling scheme for the current raster basemaps 5 new small-scale levels have been added. This means that the scale level IDs represent a different scale. For example, scale level ID 10 in the Classic basemaps equals scale 1: 18,055.954822. In the current raster basemaps scale level id 10 equals scale 1:577,790.554289. To maintain the same scale level, you need to update the app to zoom to scale level ID 15.
    Your ArcGIS 3D Scene or ArcGIS 3D application uses other tiled layers on top of the basemap

    3D Scenes and applications are stricter when it comes to using different tiling schemes. When your 3D scene or app has a tiled layer (raster or vector) on top of one of the Classic basemaps you will most likely need to re-tile that layer using the same tiling scheme as the current NZ Basemaps. The tiling scheme can be found here.

    Update your basemap gallery

    If your organization uses a custom basemap gallery, we recommend you remove the raster basemaps that are in mature support and replace them with either the vector basemaps or the current basemaps. As this basemap gallery can be used in other locations than the Map Viewers, for example in ArcGIS Web AppBuilder applications, make sure to test if this change has any impact on your current applications, especially when your custom basemap gallery has a combination of Eagle Technology basemaps and custom basemaps that are cached using one of the Classic tiling schemes.

    When updating your basemap gallery group, make sure to add the Web Map to the group and not the layer.

    To find out how to update your basemap gallery, see this blog post:

    ArcGIS Living Atlas

    The basemaps that are in mature support or are moving to mature support are no longer available in Living Atlas. They have also received the “Deprecated” tag. This ensures they are prioritized less in search results. You can find all the Classic basemap items in this group.

    If you have any questions about this move, please get in touch with your Eagle Technolgy representatve or contact us at livingatlas@eagle.co.nz.
  • Updates to the New Zealand Imagery and Elevation layers (May 2022)

    Updates to the New Zealand Imagery and Elevation layers (May 2022)

    Since the start of the year the New Zealand Imagery, the New Zealand Elevation and the New Zealand Hillshade layers have received new data updates. This blog post gives an overview of the recently added datasets.

    New Zealand Imagery basemap

    The NZ Imagery basemap is made up of the best available public Imagery data and contains high resolution imagery for most parts of New Zealand. The following datasets have been added this year:

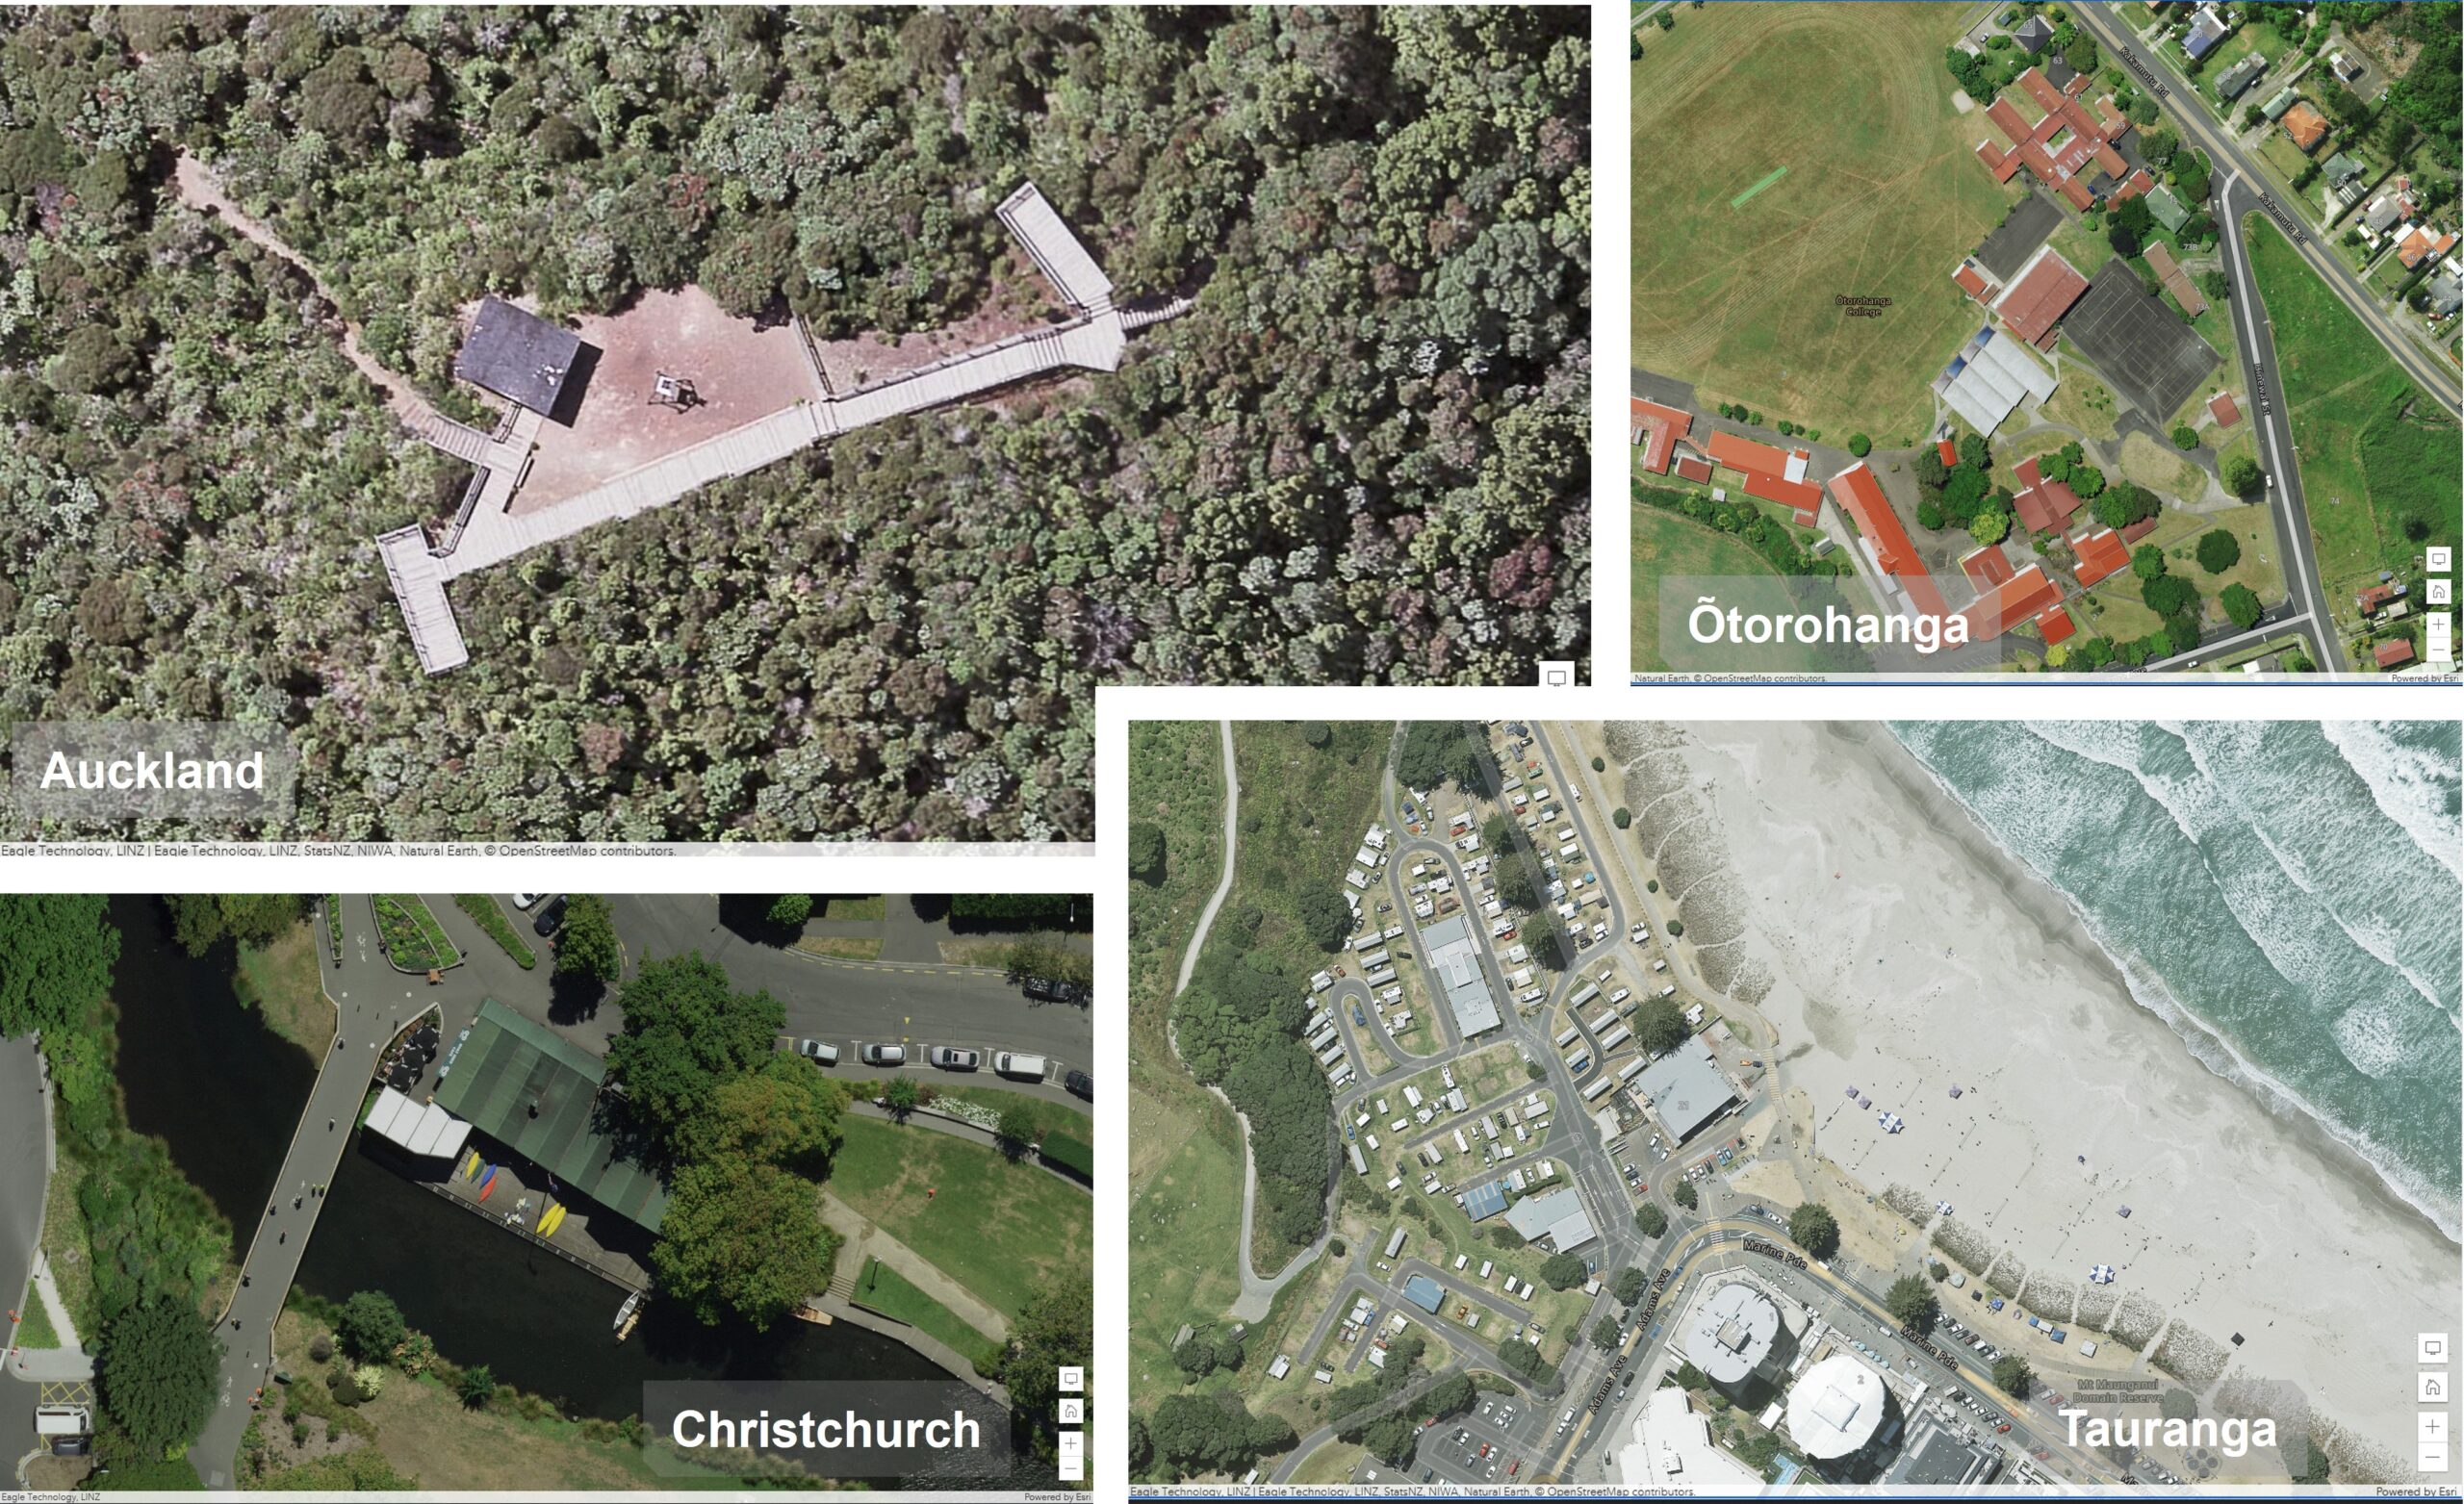
    • Christchurch Urban 2021 5 cm resolution
    • Tauranga Urban 2022 10 cm resolution
    • Ōtorohanga Urban 2021 10 cm resolution
    • Auckland Rural 2022 7.5 cm resolution

    Imagery screenshots

    You can find the NZ Imagery basemap in ArcGIS Living Atlas. Last year we have also released a vector basemap reference layer in NZTM that is designed to be overlaid on the NZ Imagery basemap. We also have a NZ Imagery Metadata layer available to shows what datasets are in the Imagery basemap. Currently it shows all the datasets that are used to build the basemap, because there is a lot of overlap on the imagery, we are working on an updated version of this layer to show what datasets are shown in the basemap.

    New Zealand Elevation layers

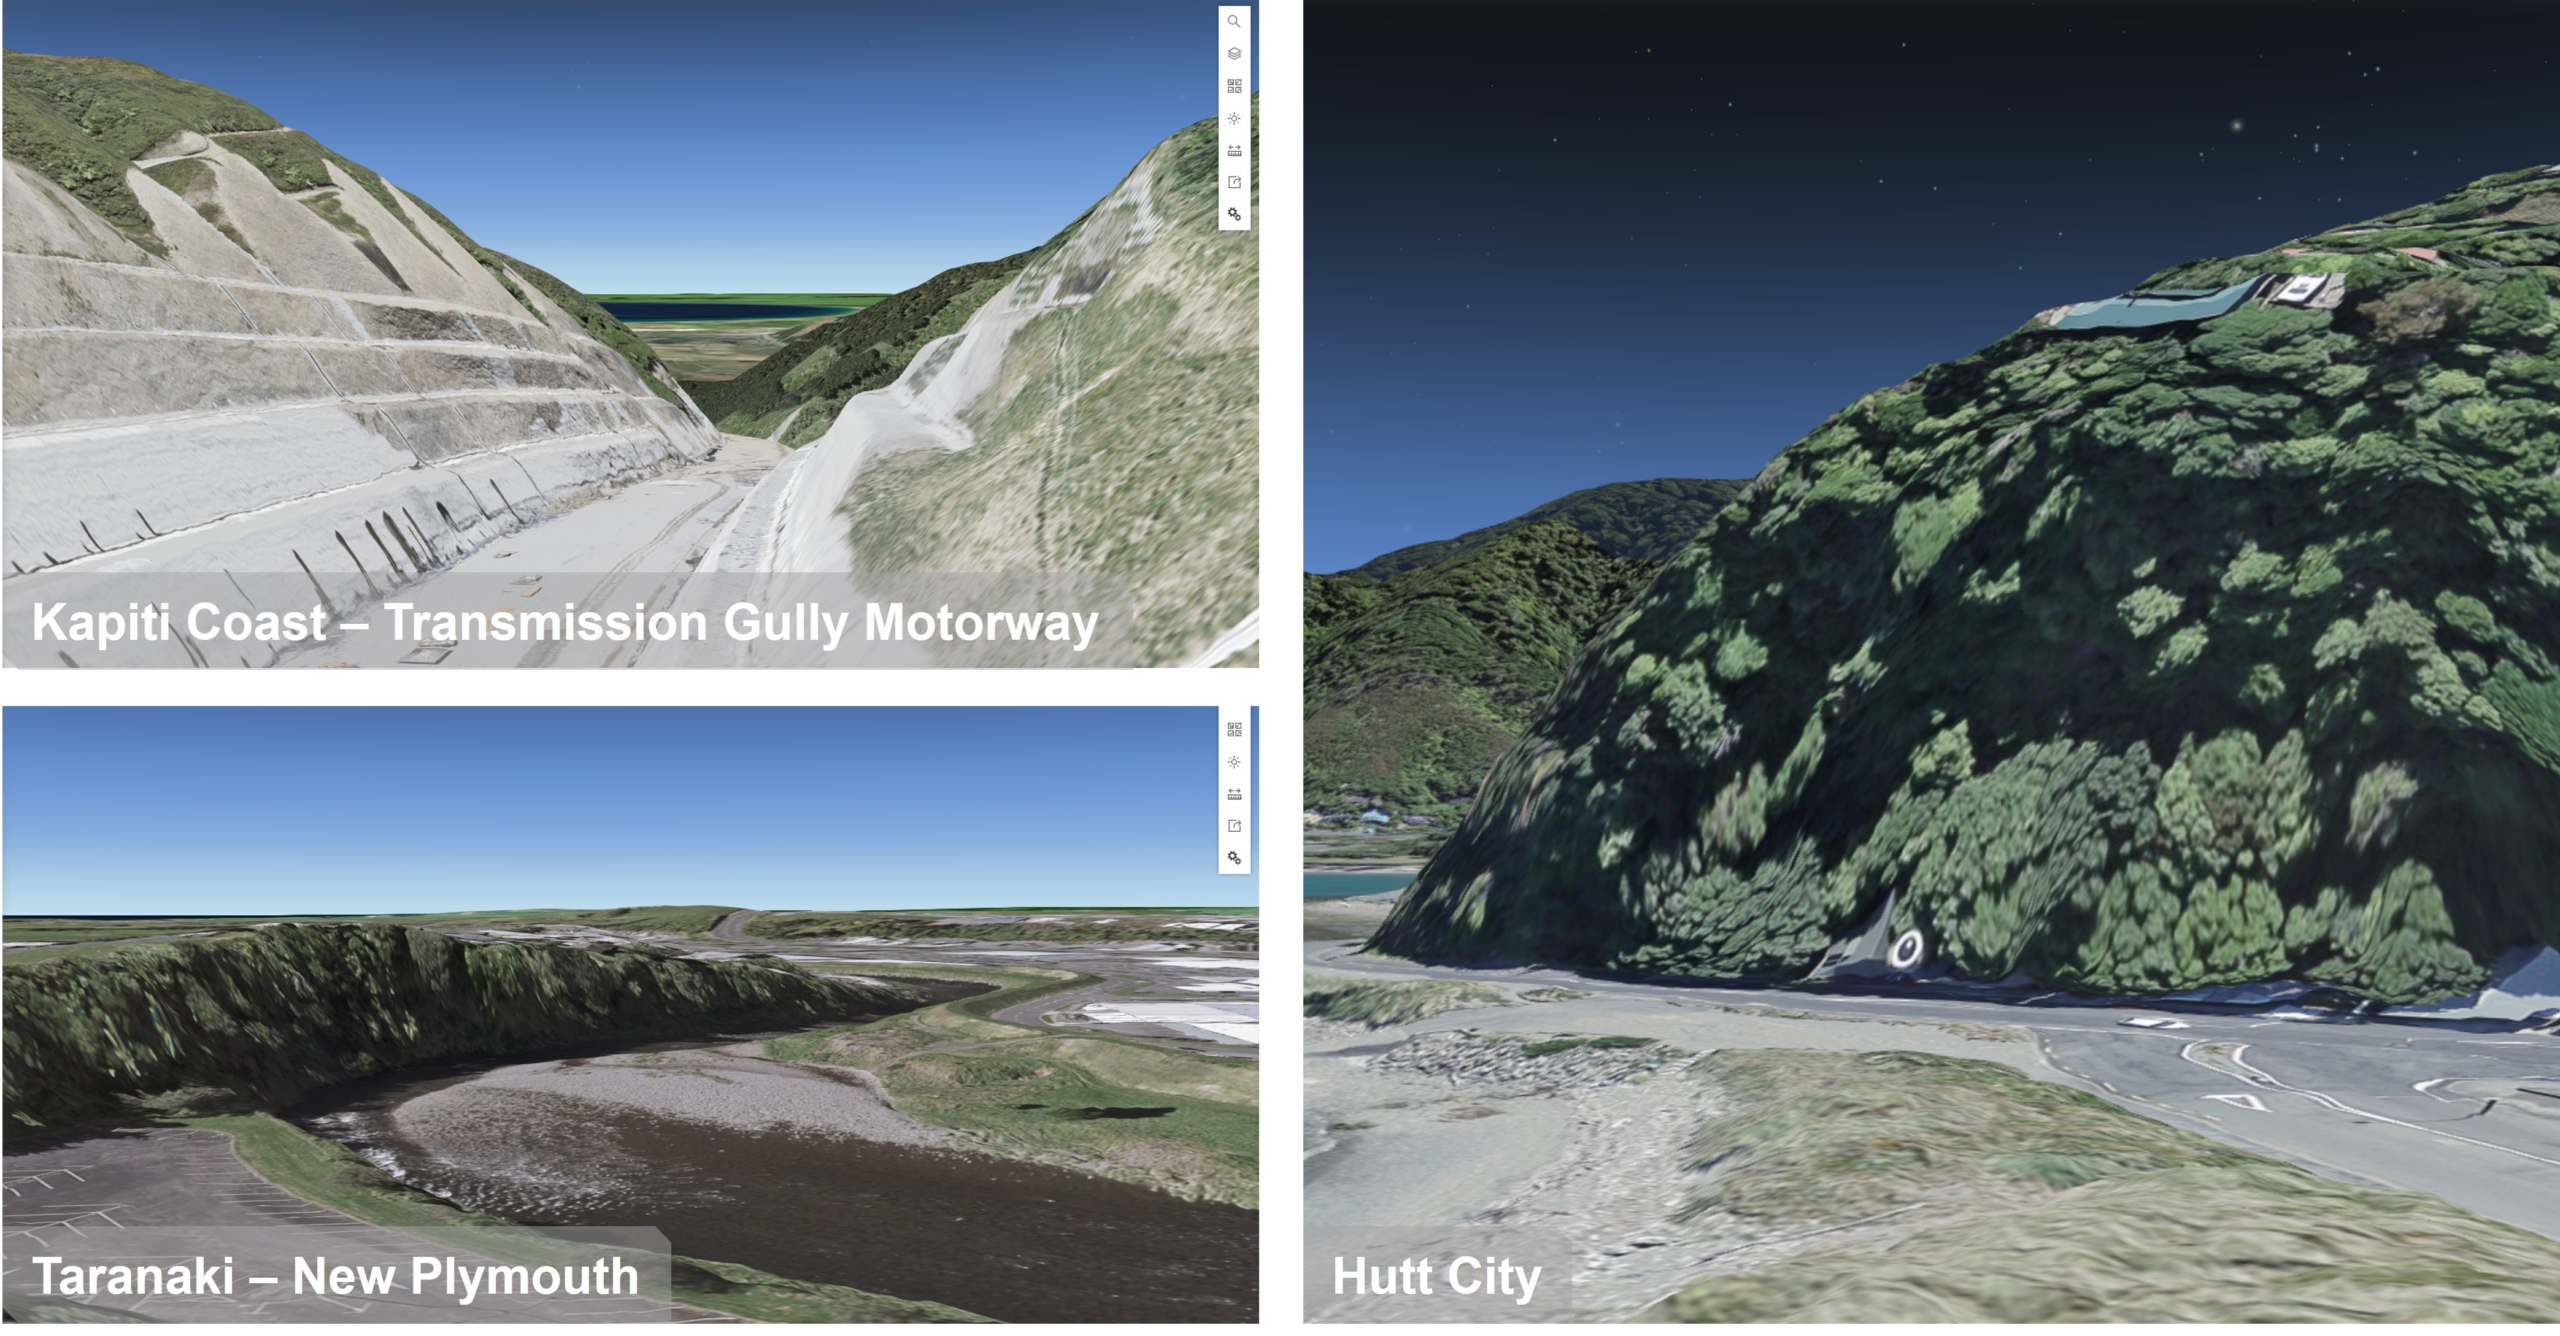
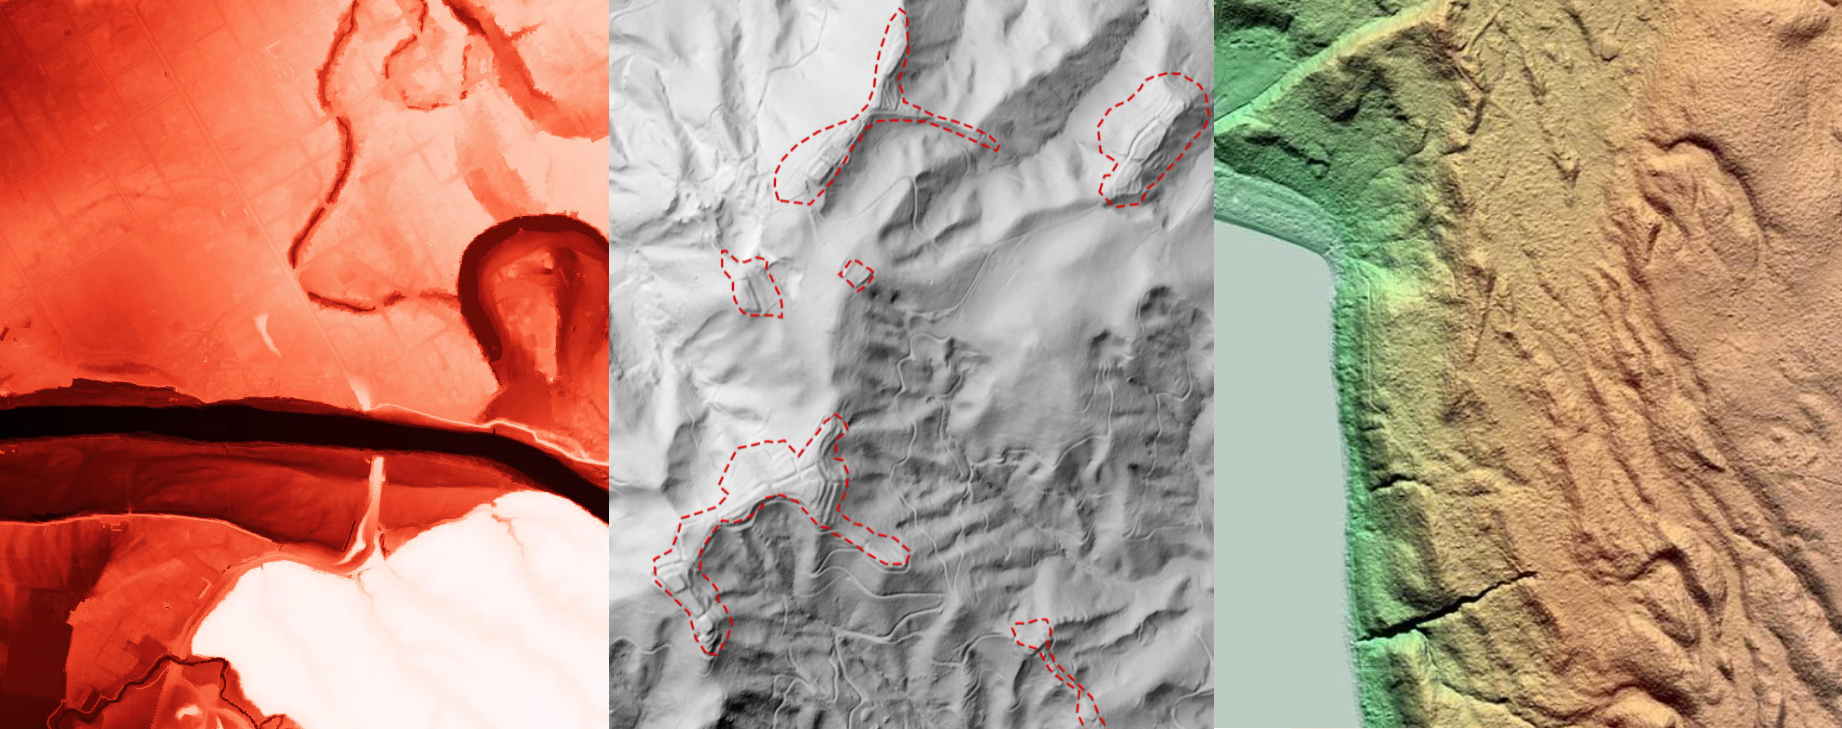
    Lots of LiDAR is being captured currently in New Zealand and a couple elevation datasets have been released this year already. These datasets are being added to both the NZ Elevation layer and the NZ Hillshade layer.

    The NZ Elevation layer is designed to be used in 3D maps and apps as a base layer to visualize the terrain. The NZ Hillshade layer is designed to be used with the NZ Topographic Relief basemap to give more context about the terrain.

    The datasets that have been added this year so far are:

    • Kapiti Coast 2021
    • Hutt City 2021
    • Taranaki 2021

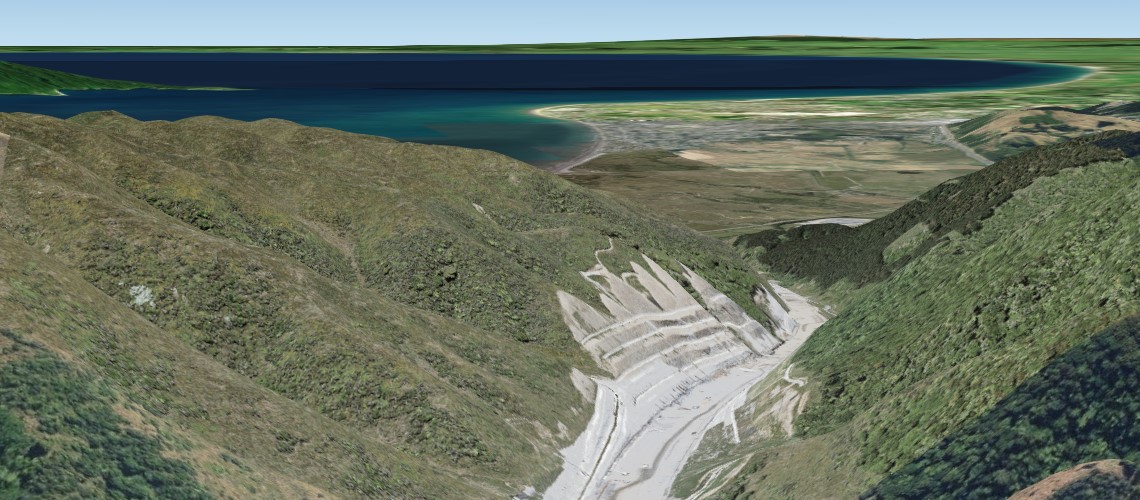
    elevation layer screenshots

    A full overview, of the more than 50 datasets that are in the NZ Elevation layer and the NZ Hillshade layer, can be viewed by using the NZ Elevation Metadata layer.

    New Zealand elevation data in Esri’s World layers

    The Terrain Dynamic Image service from Esri also includes the New Zealand elevation data. All the datasets will find its way to this layer as well as to Esri’s other derived layers like the Terrain 3D (Esri Elevation layer) and the various Hillshades all in Web Mercator. It can take a few months before the datasets make into Esri’s layer, due to their release cycle. A good read on the latest update on Esri’s elevation layers can be found here.

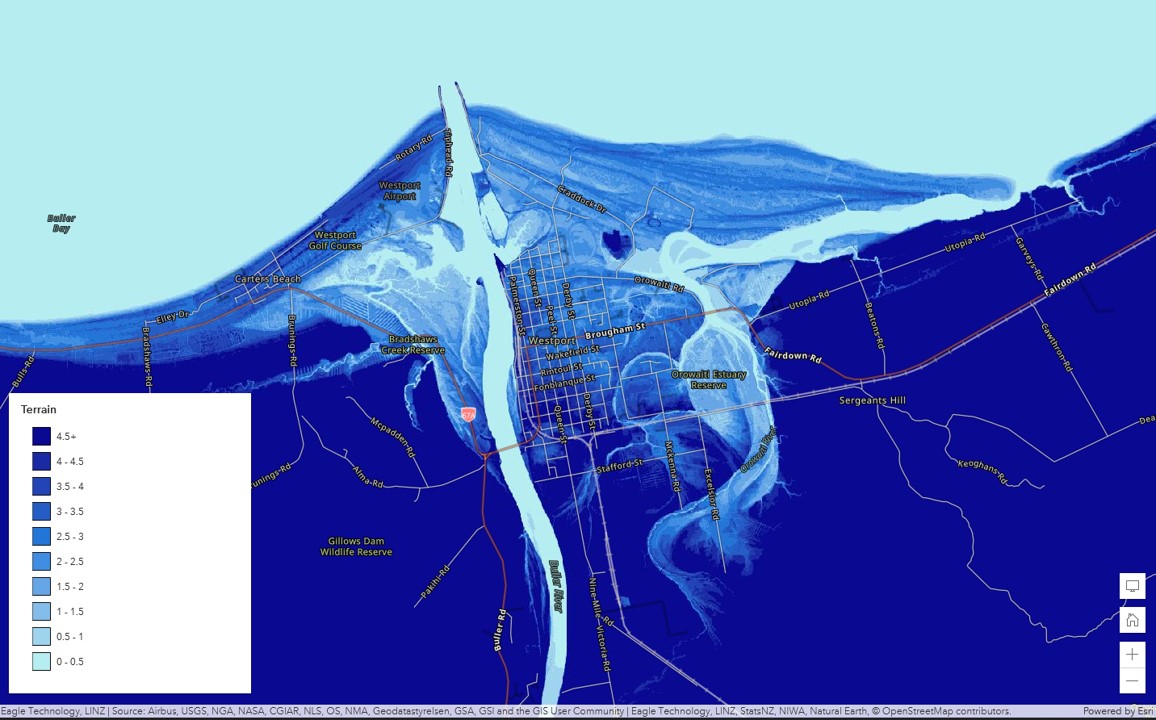
    Esri terrain layer visualized in classes

    For any questions on these layers or other Living Atlas content, please reach out to us at livingatlas@eagle.co.nz.
  • NZ LiDAR Competition

    NZ LiDAR Competition

    With the NZ National Elevation Programme providing more and more freely available LiDAR data for NZ, we wanted to hear about some of the great ways in which you are using this treasure trove of data along with ArcGIS to solve issues of all kinds, all scales and all across New Zealand.

    So, to help gather these stories, we are asking you to tell us about your work based upon the newly available LiDAR data as well as derived data sources such as Eagle Technology’s Elevation WebService which incorporates this data.

    We believe that this data, when combined with tools such as ArcGIS Pro, 3D scenes and Deep learning workflows, will open up opportunities for almost every sector in the country and with your permission, we will share your stories with LINZ, helping to show others what’s possible as well as helping reinforce the business case for future investments of this kind.

    On top of this though, we will also be choosing one story which shows innovation in addressing a real-world issue for NZ for a little bit more celebration…

    This one submission which we feel really stands out, will be showcased on our website as an example to others and in recognition of your work, we’d like to take the opportunity to host you and your team on the Eagle Magic for a day’s private charter!

    So, how do I submit my story?

    Create a StoryMap to tell us:

    • How you are using ArcGIS + NZ LiDAR together (LiDAR from the NZ Elevation Programme or derived products)
    • What problems are you solving? How are you making a difference for those outside of the GIS industry? How are you doing things more efficiently or effectively?
    • What kinds of innovations are you making (big and small)?

    Then simply send us a link to your StoryMap before the 28th February 2022 closing date: nzeuc@eagle.co.nz

    Good luck and we can’t wait to hear about all of your cool projects.

  • NZEUC 2021 – Videos, Resources, Competition and Feedback

    NZEUC 2021 – Videos, Resources, Competition and Feedback

    With the move to virtual for this year’s NZ Esri User Conference (NZEUC), we chose to split the whole-day sessions into a plenary 1/2 day followed by 4 separate stream webinars over the 2 following weeks. While we are missing out on the face-to-face connections of the in-person events, going virtual has allowed these events to be open to all and as a result we have had well over 1000 registered participants for the few first events.

    Virtual also means that for those of you who missed the live events, you can still get your dose of NZ-flavoured GIS technology and stories by watching the session recordings as many times as you like!

    To make this easy we have created a Playlist of all of the NZEUC 2021 sessions which you can watch as a whole or as individual portions as well as a document with some great links and supporting resources.

    As you may have seen in the Imagery and LiDAR webinar earlier this week, we have laucnhed a competition to have you all share the great work you are (and will be) doing with ArcGIS and data from the National Elevation Programme – you can read more about this here.

    And of course, we really want to make our events (virtual and face to face) as good as they possibly can be and so we’d love to hear how your NZEUC 2021 Expereince was. So please, please (please) do take a few minutes to give us your feedback here:

    https://www.surveymonkey.com/r/YL9973H

    Finally, a great big thank you again to all of our presenters and contributors and we look forward to seeing you (virtually) online.

  • GIS Emergency Assistance Resources from Eagle Technology

    GIS Emergency Assistance Resources from Eagle Technology

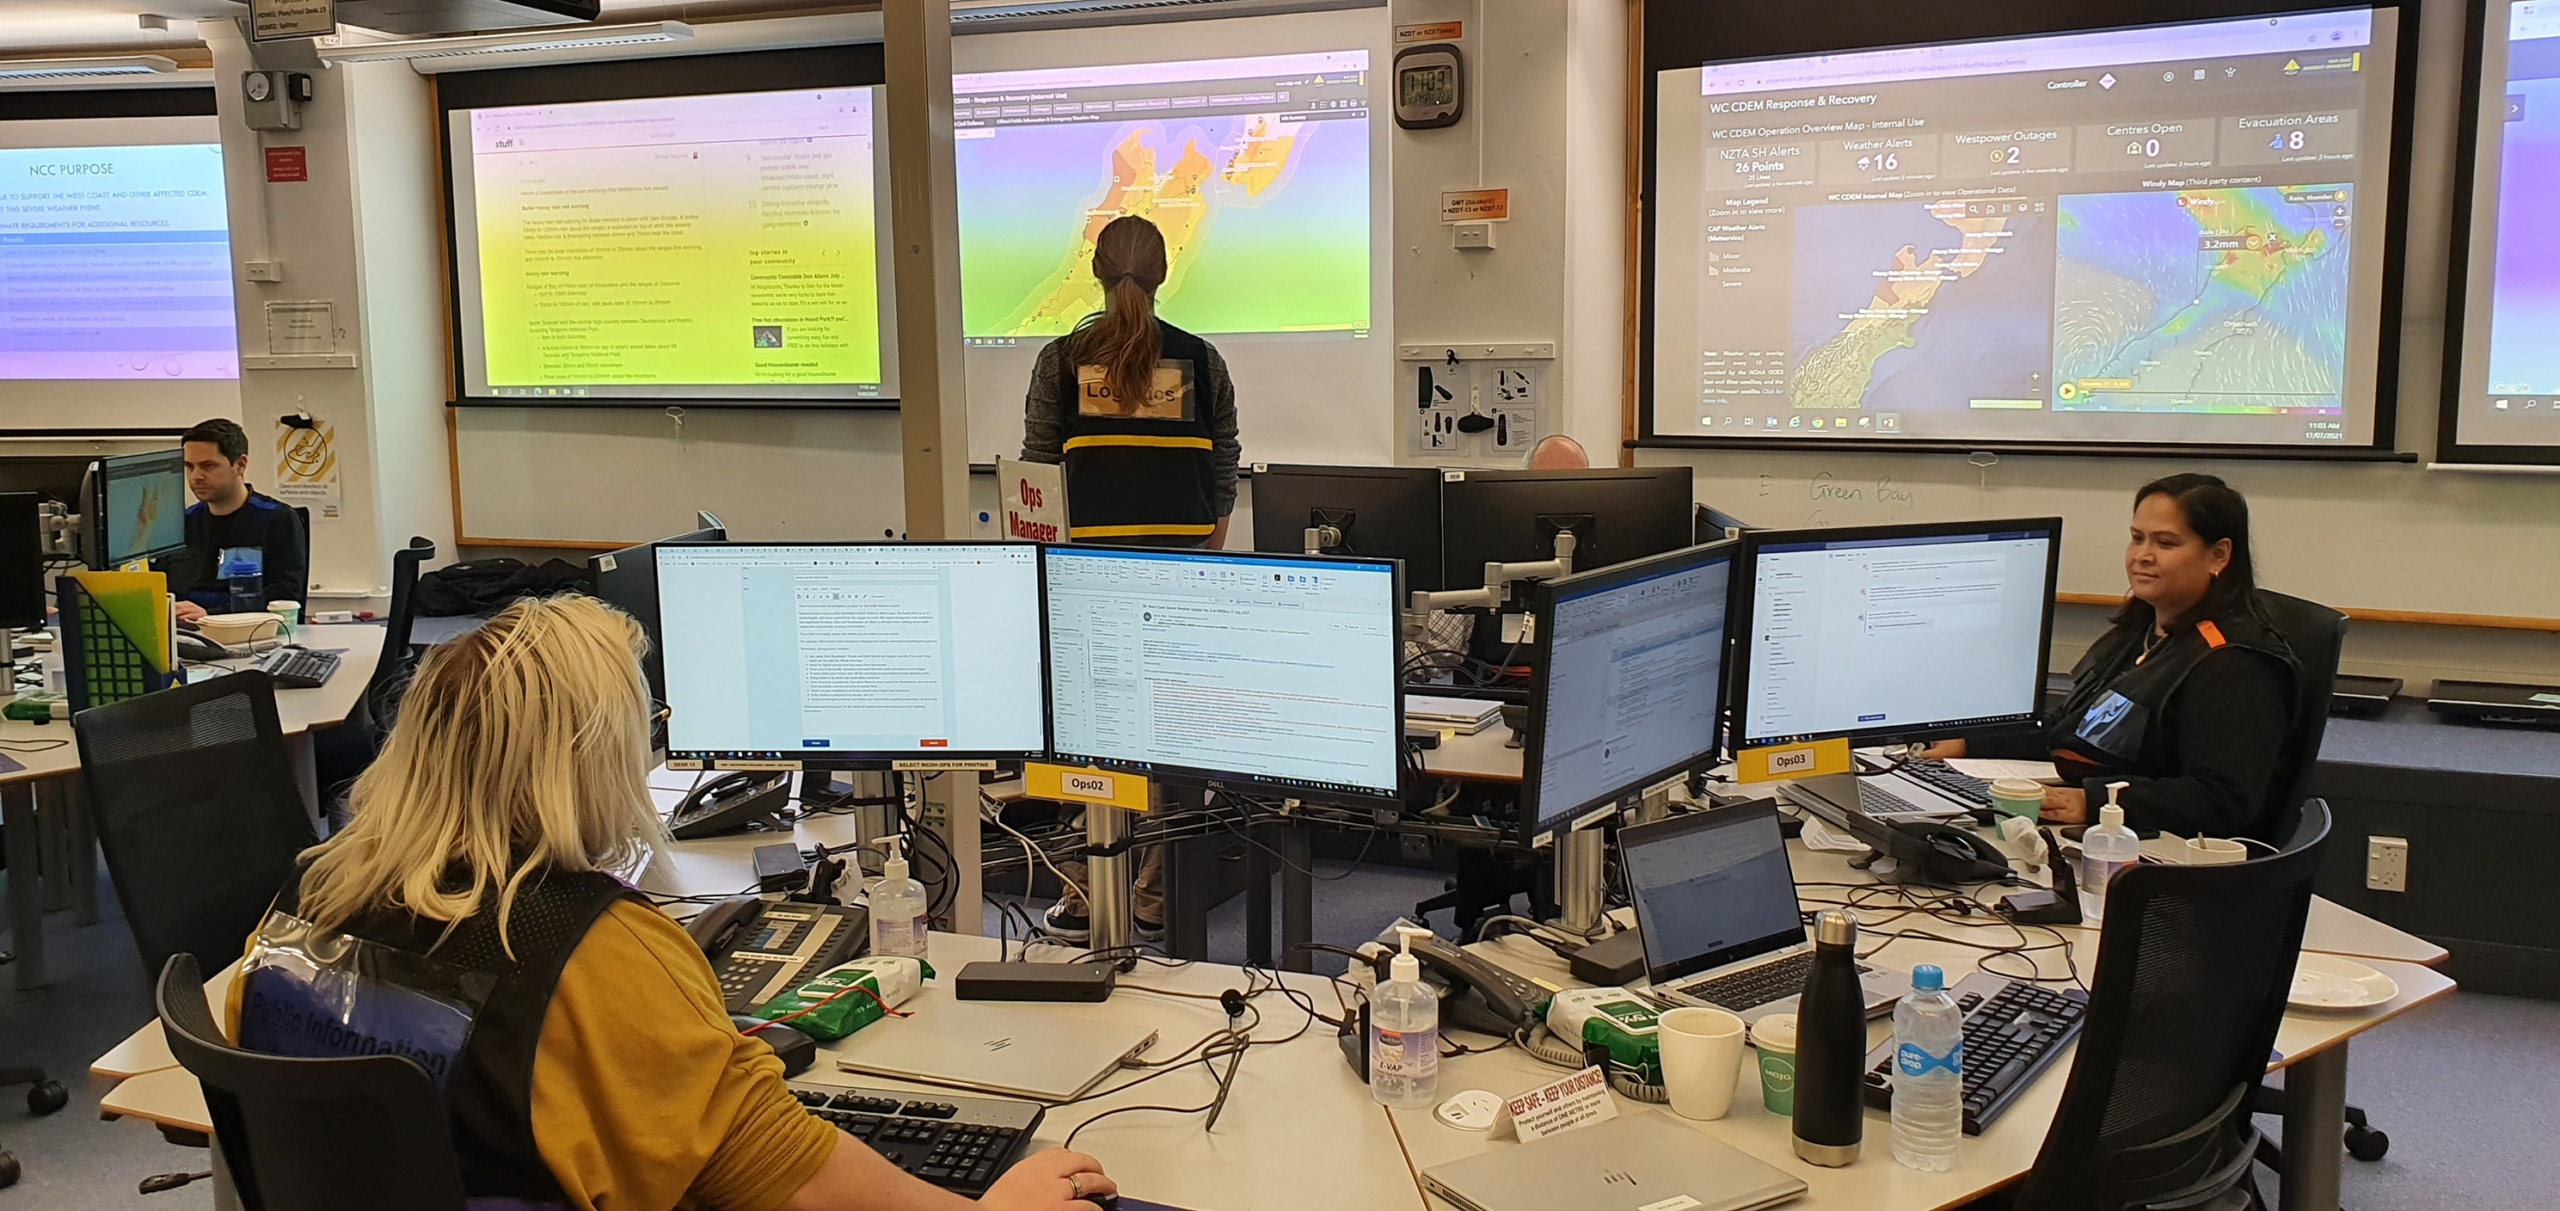
    GIS has become integral to managing emergencies in New Zealand. This includes many Emergency Management-focussed organisations who use and embed it within their intelligence processes to collect, store, analyse and display information for decision-making before, during, and after events.

    Alongside this, many organisations that do not have an Emergency Management focus but who do carry out vital operations (such as utilities, transportation or agriculture) also use GIS to assist with their planning and work when they are affected by adverse events.

    As part of this, the team at Eagle Technology has a long history of supporting our customers during emergencies in a variety of ways and so, in order to better streamline this work, we have recently introduced a dedicated channel to request assistance. This includes a dedicated email that is monitored by our specialists within business hours and is designed to assist you in getting specialist GIS support required in an emergency.

    EMSupport@eagle.co.nz

    Once the email request is received, we triage and allocate our resources and expertise to assist you based on your requirements. We will do our best to support you when you need it most and this may include emergency licensing, technical support, application templates, and much more.

    To complement this the Eagle Technology Emergency Hub is our new landing page for GIS technical resources no matter what your event. It brings together authoritative and publicly available content which others have found useful in previous events, in a single place. This is a new iteration of our COVID-19 site and will be updated regularly as new resources become available.

    As always, the best way to deal with emergencies is to be prepared and so the team at Eagle Technology has developed a series of workshops and other training resources to assist in upskilling your team to be able to make the best use of the ArcGIS tools for many aspects of emergencies. These include optimising field assessment workflows; configuring dashboards to get a complete picture of the situation in real-time; and best practices regarding securely sharing and consuming other authoritative GIS data sources. You can learn more about these on our training webpage as well as watch a recording of the recent Emergency Management Webinar.

    We are proud to be able to support the work that you all do to support our communities to better withstand impacts from adverse events, and with these new resources, allow you to get the capabilities, content, and support you need faster – when you need it most.

  • GIS Technology for NZ Agriculture

    GIS Technology for NZ Agriculture

    Agriculture is one of New Zealand’s leading industries, employing thousands of people and contributing to a significant portion of the country’s overseas trade. With this scale, it is unsurprising that regulation is increasing as part of ensuring that economic gains of agriculture do not come at too high a cost to the environment alongside an increasing consumer desire, both domestically and overseas, for sustainably produced food.

    Given this increasing pressure and intensity, there has also been a huge increase in the number of apps created for the sector over the last few years. These apps range from those provided by large sector players (such as the fertiliser providers) to those created by small, focussed start-ups, but what has been particularly interesting is that almost all of these have spatial technology embedded inside in some form. While this spatial technology ranges from dropping a map in the corner of the user interface for context, to having full spatial analysis using machine-learning, it does reinforce the importance of location to those whose work is intrinsically linked to the land.

    Eagle Technology’s own work in the agriculture sector is focused upon using location for connecting otherwise disparate datasets, producing insightful and compelling maps and connecting users across organisations.

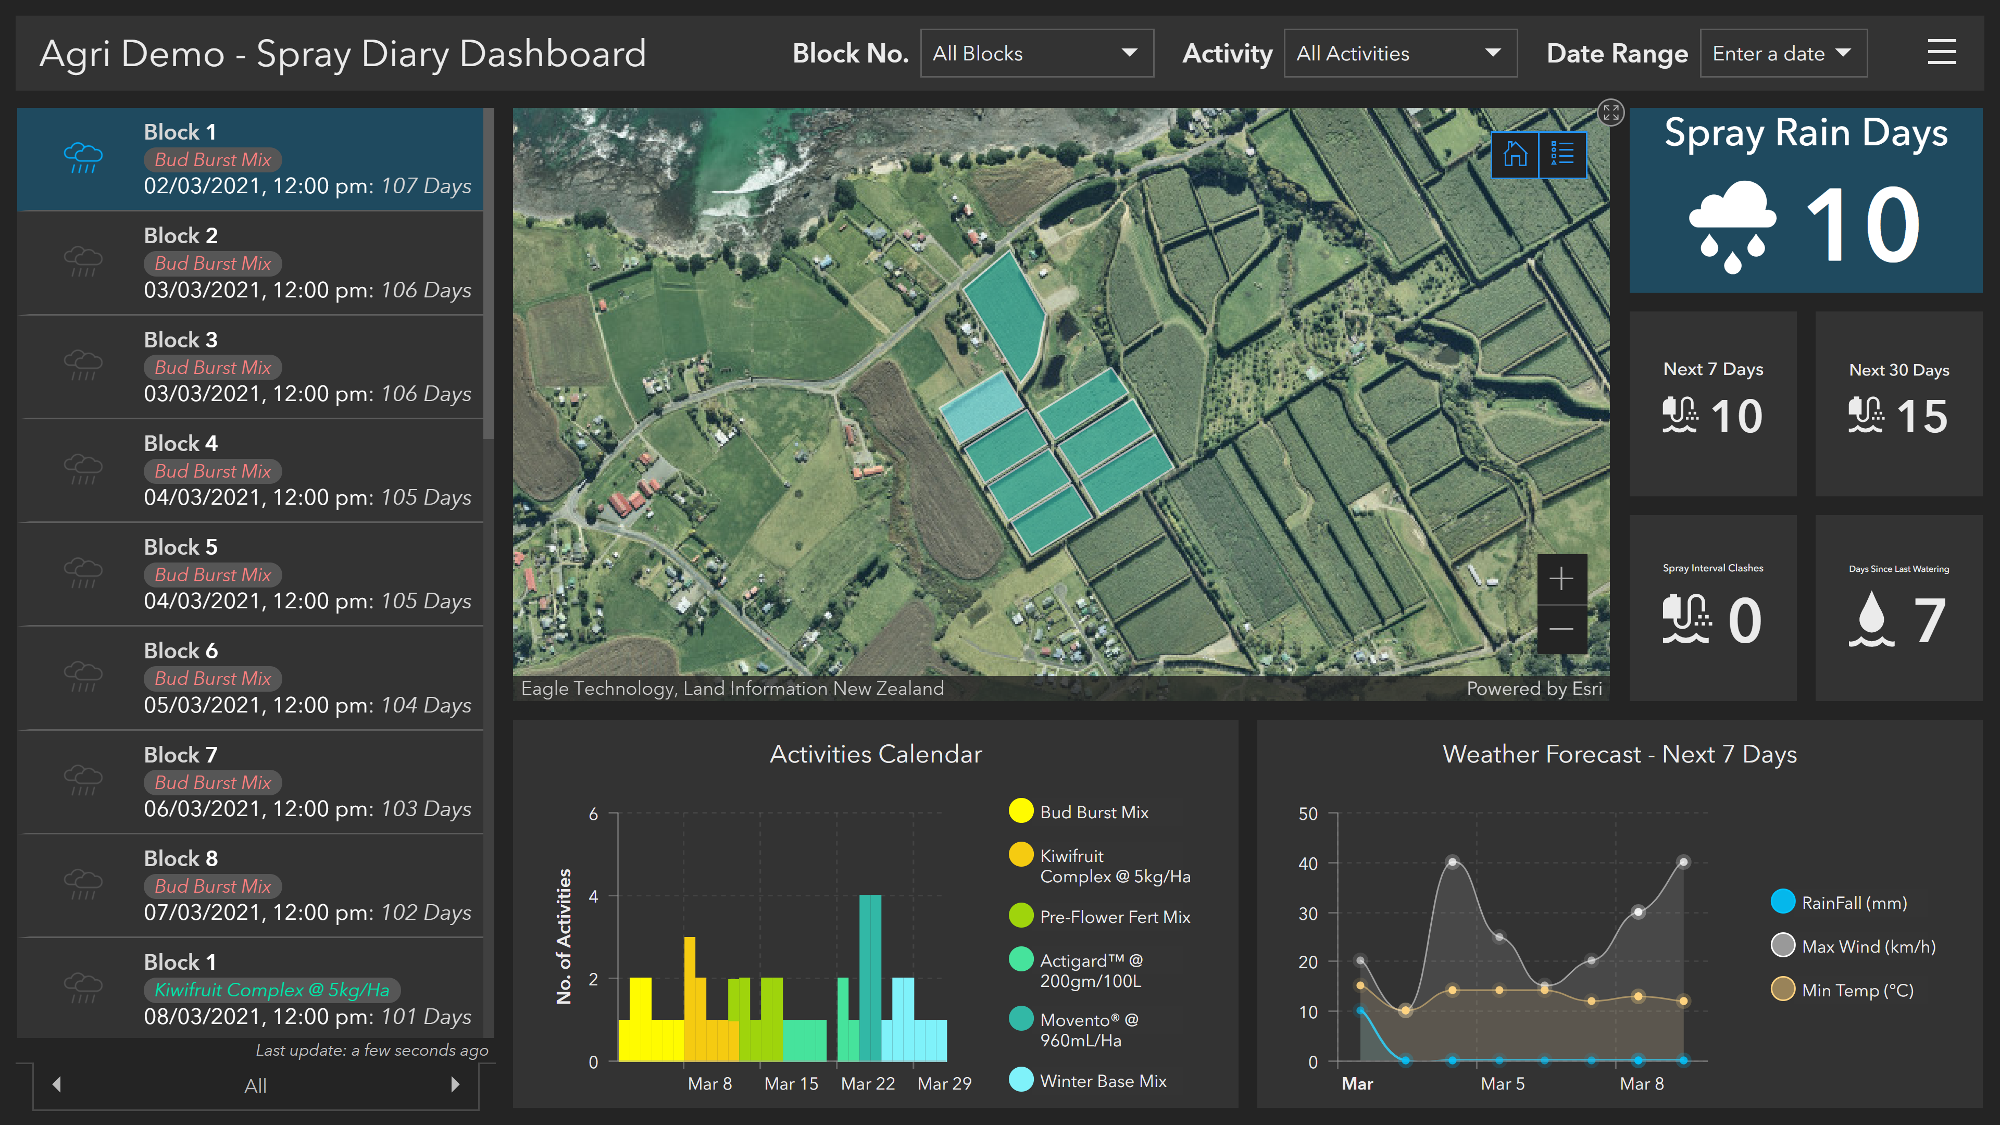
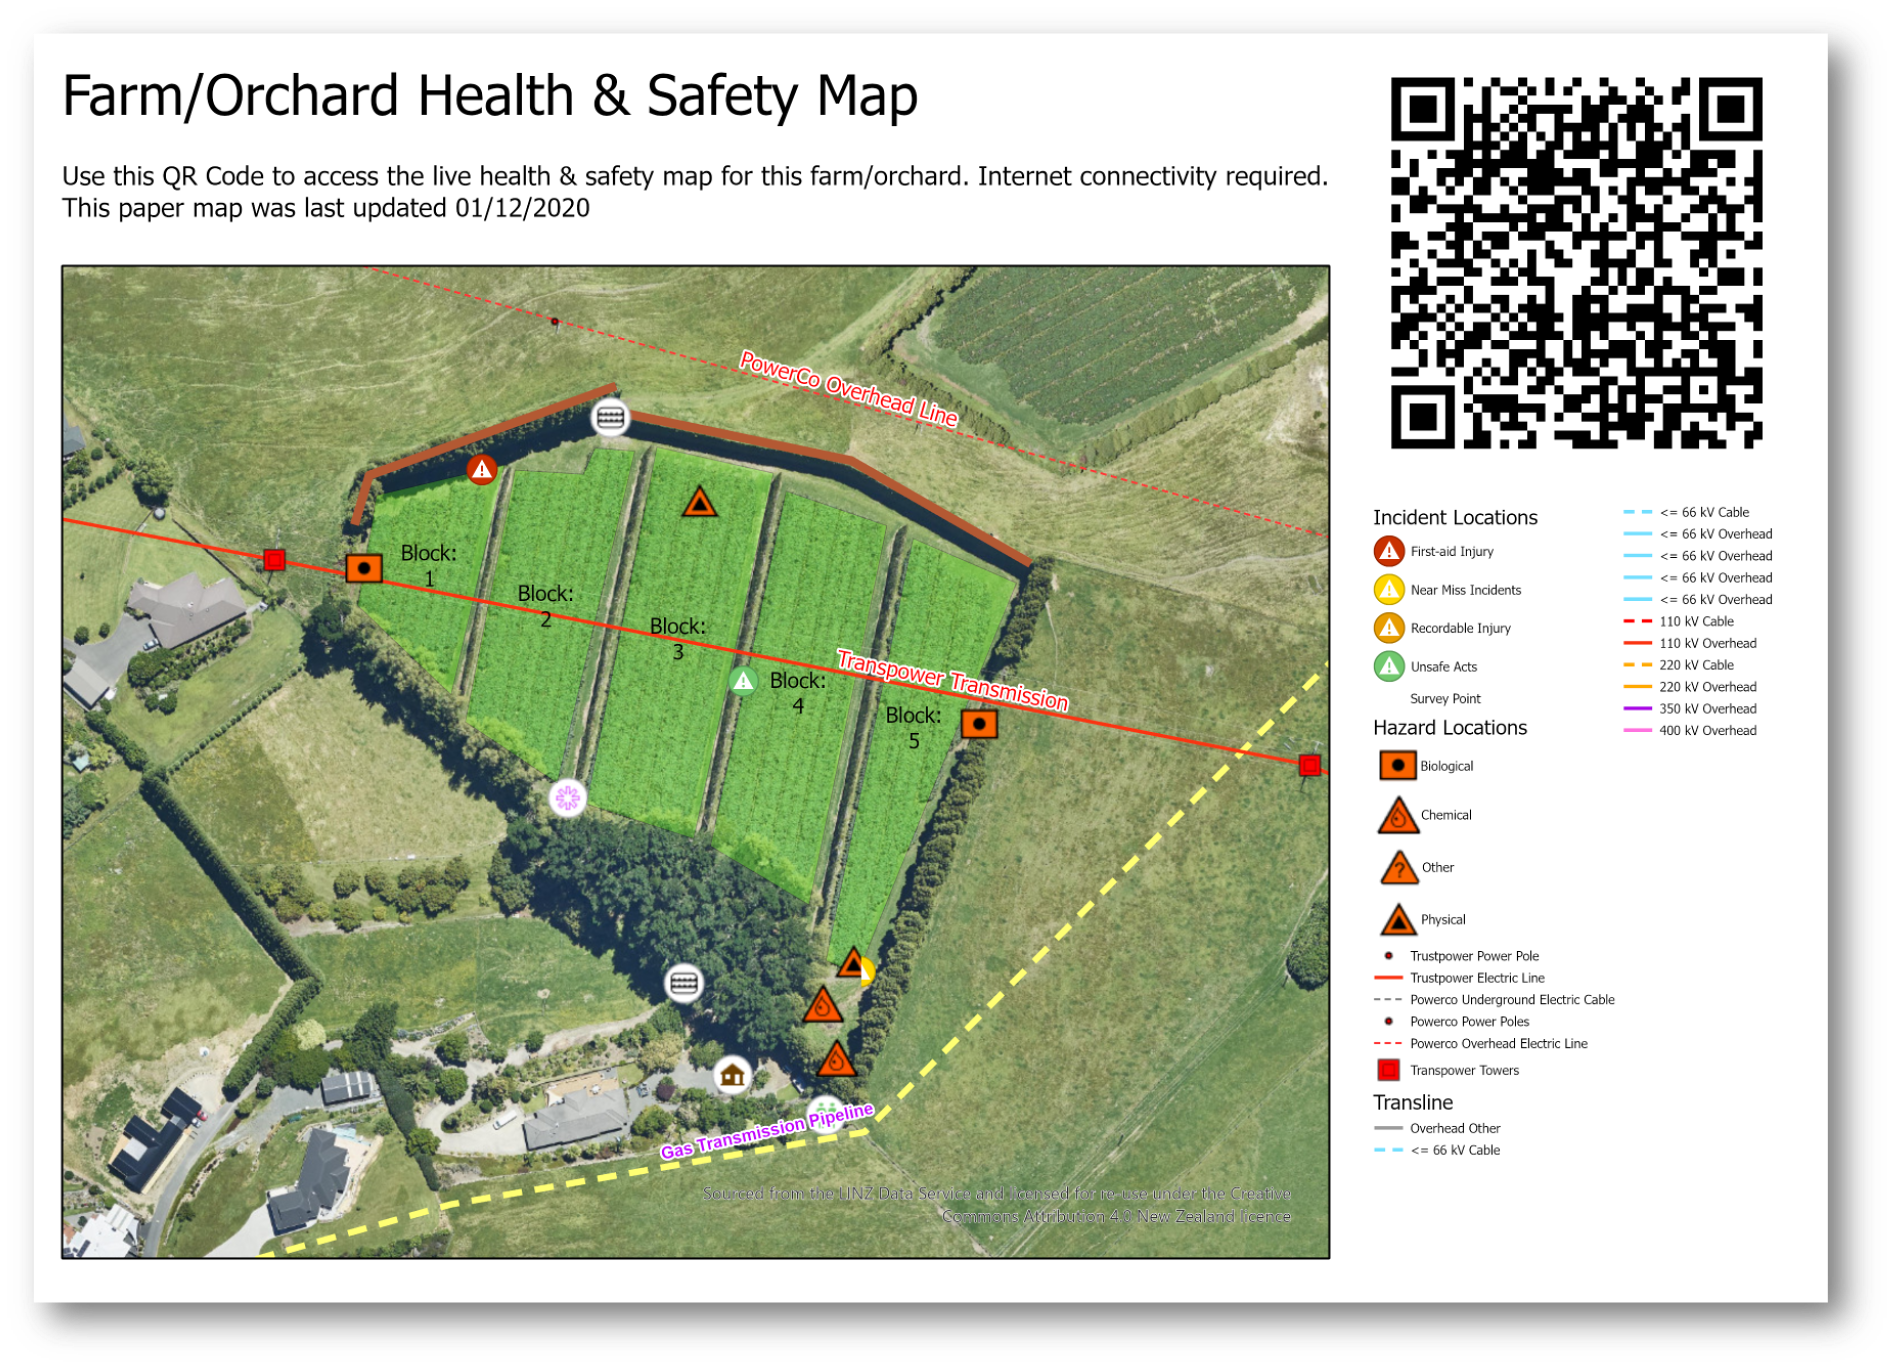
    Map Images represent demonstration data only

    We recognise that in agriculture especially, key decisions are being made at a national, regional, local and paddock level every day and that these decisions affect both the environment and the viability of farmers’ businesses. Therefore, having connected and data data-driven tools, combined with accurate and authoritative sources of data in the hands of all decision-makers is key to achieving the best outcomes.

    This is work we have been doing for many years through providing ArcGIS solutions and while there has been a great range, both in scale and scope, of ArcGIS applications, they can be summarised into 5 key areas:

    • Mapping & visualising all farm-related data – bringing data in many forms into the GIS as a “one-stop shop” live view of farm operations and assets. Alongside the farmers’ own data, data sources include external sources from councils, satellite imagery, slope, land parcels and other data which is included inside ArcGIS.
    • Better understanding crop health & productivity – using various location-based data sources within blocks/paddocks (yield/pests/quality) to visualise and model the health and productivity of crops and/or livestock.
    • Monitoring farms with sensors & drones – capturing data in near real-time which allows us to understand how things are changing across the farm and connecting these to other data layers.
    • Improving compliant & sustainable practices – supporting land stewardship through identifying, reporting, and mitigating issues with simple to use apps and reporting tools that combine to give a living record of the land.
    • Making our farms safer – promoting safety through awareness of hazards as well as easy reporting of incidents and hazards using apps while also supporting data sharing between systems.

    Across all these areas there is also a range in the levels of complexity or sophistication. For many applications, the key is using proven technology configured to the specific workflows and environments of the agricultural sector. Mobile technology is a good example of this where we have seen great benefits through taking the next generation of Esri’s field apps and dashboarding tools out onto farms, capturing everything from health & safety hazards or farm assets and measuring crop health or fruit quality. Another is access to high-quality, accurate data such as Eagle’s Imagery Basemaps which can be taken offline using the apps and which can be augmented to be even more up to date by adding premium imagery from our Planet, Maxar and Nearmap data partners.

    At the more “cutting edge” end of the spectrum, here at Eagle Technology we’ve been involved in some pretty exciting areas, including integrating ArcGIS with blockchain to support provenance use cases; as well as the great work being done with advanced image analysis and deep learning – using satellite and aerial imagery to understand variables such as nitrogen levels or soil moisture.

    One recent and significant change is how all of this capability can be consumed. This has come about with the introduction of ArcGIS Platform. This is a developer-focused business and technology model designed for those who wish to geo-enable their own technology with the rich ArcGIS capabilities but without turning their application or licensing models into an actual GIS. Allowing you to use basemaps and analysis on a consumption basis and to use this with other non-Esri mapping technologies such as Leaflet or MapBox.

    Of course, none of these approaches are mutually exclusive areas and one of the major benefits of using a system like ArcGIS is joining the dots of apps, data and workflows: allowing data to be easily captured and analysed and then made available via apps, dashboards and WebMaps to decision-makers, all in near real-time – a pattern we are increasingly seeing on farms, vineyards and forests across New Zealand. Alongside this is the current work being done by AgriTech NZ around spatial data interoperability between systems – work which we at Eagle are heavily involved in and see as unlocking some real opportunities for data sharing between systems.

    To learn more about the developments in this area come and see us at the 2021 Fieldays stand or check out the Eagle Technology AgTech Page.

    Map Images represent demonstration data only

  • A tribute to Anne Olsen

    A tribute to Anne Olsen

    It was with great sadness that we heard about the death of Anne Olsen from cancer Monday 31 May 2021.

    Anne was one of the foremost thinkers and contributors to the New Zealand GIS in Schools Programme. Along with a small number of other New Zealand teachers including Sally Brodie, Nick Page, and Stephaine Eddie, Anne championed the use of Esri products in the classroom to enhance geographic thinking and problem solving from the very early days of the GIS in Schools Programme. Her championing of the geospatial cause in the education sector spanned over 20 years progressing from installed software ArcView 3.x through to the use of ArcGIS Online in the classroom in more recent years.

    Anne not only made sure that the software was available in the classroom to teach GIS she and Stephaine, through their company, provided resources and professional development workshops for teachers throughout New Zealand. Many of the resources they developed were released in CD form under the title IMAGIS, and provided the basis for current resources freely available to teachers today at the GIS in Schools Resources Hub

    In life, Anne’s contribution to geographic education, especially her work promoting spatial technology in education was recognised when she received a NZ Geographical Society Distinguished Service Award in 2015. In death, her contributions live on in the ongoing work of the GIS in Schools Programme which would not be where it is today without her contribution.

    We are sure she will be missed in the education industry, by her friends and, most especially her family. Kia Kaha

    Смесь цемента, песка и щебня в нужных пропорциях называется бетоном. Бетон может разной степень твердости.

    Rest in peace Anne

  • Recap: 2021 Virtual Regional User Conference Events

    Recap: 2021 Virtual Regional User Conference Events

    A great big thank you to all of you who contributed, organised, and joined us for the recent 2021 Virtual Regional User Conference Events from the NZ Esri User Group (NZEUG). While a virtual event cannot replace the face-to-face aspects of meeting with our awesome community, we felt that there were some really great stories shared as well as connections made and we saw valuable conversations taking place following the events at the various face-to-face meet-ups.

    While the NZEUG will shortly be posting recordings of the full RUC events online, we wanted to share videos of Eagle’s Technology Updates which were part of these events. These are available below as individual videos or as a complete playlist:

    Eagle Technology 2021 Tech Update Playlist

    Finally, alongside these we have compiled a list of the ArcGIS Technology related questions (and answers) from the events which you can see below:

    Question

    Answer

    Is Tree classification Basemap for NZ using deep learning available on ArcGIS living atlas

    The pre-trained Deep Learning packages can be found on ArcGIS Living Atlas. You can find them by going to https://livingatlas.arcgis.com or search for them in ArcGIS Online or from ArcGIS Pro.

    Which license can access the planet imagery and which service to use?

    Eagle is an official reseller of Planet Imagery. Despite being integrated with the ArcGIS Platform, a Planet subscription is required to access the PlanetScope, SkySat, and Planet Basemap offerings. For more information on what Planet has to offer, please get in touch with Doug_Stark@eagle.co.nz

    I’m very interested in using LocalMaps reporting to generate our LIMs. Is there a tutorial available that shows start to finish how to set everything up to achieve something like was shown?

    If you are interested in how to build LIM reports using LocalMaps, check out some great videos Josh Gore put together on the LocalMaps Geonet page here: https://community.esri.com/t5/localmaps-nz-blog/localmaps-how-to-videos-lim-reporting-working-with-tables/ba-p/1035770

    NB. If you aren’t already a member of the page, you will just need to request access first.

    Can you also include a link to the Web Appbuilder developer edition support/ tutorials please?

    https://developers.arcgis.com/web-appbuilder/guide/xt-welcome.htm

    Question about Map Viewer now out of Beta: when will we be able to embed the maps directly into websites i.e. via iframe (taking advantage of new JavaScript). Classic can but doesn’t support the latest JavaScript. cheers

    There is no current specific date for this, however, a workaround, for now, would be to make a basic experience builder application and embed this.

    Separate labels from the Vector tiles basemaps! Can’t wait 🙂

    We are hoping that the separate labels will be useful for a lot of people!

    Regarding the AI tools, will they require any level of programming expertise to run?

    No. Several tools that use AI and machine learning are provided out of the box with ArcGIS Pro now. They will require training-dependent needs. See an example video here – https://www.youtube.com/watch?v=KCkGif6wSMo.

    You can also build your own model/tools which will require knowledge around scripting and possibly programming.

    Will ArcGIS Velocity replace Geoevent Server?

    No. It’s complementary and different with pros and cons on each option. Happy to discuss further and provide a breakdown.

    What is the Enterprise 10.9 release date?

    At this moment there is no set date yet. It’s planned for Q2 2021, so we should be seeing it released very soon!

    Is there a way to change existing ArcGIS Online organisations to use the Asia Pacific region data hosting?

    Migrations are not supported at this stage. The APAC region is only available for new instances at this stage but please discuss further with your Account Manager.

    When will WMTS be supported for the beta map editor?

    There is no timeframe for implementation at this stage.

    How can we start using the national LiDAR Elevation service?

    Currently, we have a layer in ArcGIS Online that is in alpha. It contains the 1 metre DEMs for Wellington, Auckland, and Christchurch. We are currently working on adding all the currently available publicly owned LiDAR data to the layer. We will be releasing an update for this in the next few months and will send out communications about it on our blog and social media channels.

    Is information regarding the online reporting use case available?

    Yes, it is! We have some great walkthrough videos explaining how to use the LocalMaps Reporting on our Community Forum here: https://community.esri.com/t5/localmaps-nz-blog/localmaps-how-to-videos-lim-reporting-working-with-tables/ba-p/1035770

    NB you will need to be a member of the page to view but just request access and we can sort it

    Is partnered collaboration exclusive to AGOL? or could you do an external-facing portal to AGOL collaboration for example?

    Partnered Collaboration is only available between ArcGIS Online portals. There are patterns where you combine Distributed Collaboration and Partnered Collaboration. For Example, you can set up a Distributed Collaboration between your ArcGIS Enterprise and ArcGIS Online and have your ArcGIS Online portal be part of a Partnered Collaboration.

    For ArcGIS Pro, will the Locate be more like ArcMap’s as I find it difficult to search for features?

    The ArcGIS Pro Locate tool lets you search locations using the geocoder and it allows you to search features in layers. By default, all layers and all fields are selected for the search, but you can easily select a specific layer and specific fields in that layer. Also new in a recent release is the search function in the Attribute Table. Using the context menu of the Attribute table or just CTRL+F, search (and replace). You can select a single field or multiple fields you want to search in.

    What is Kubernetes?

    Kubernetes (also known as k8s) is an open-source container orchestration platform that automates many of the manual processes involved in deploying, managing, and scaling containerized applications (such as ArcGIS Enterprise). Some specific information on ArcGIS and Kubernetes is available here: https://www.esri.com/arcgis-blog/products/arcgis-enterprise/announcements/arcgis-enterprise-on-kubernetes-qa-from-dev-summit-2021/

    Are you able to share some resources about partnered collaboration?

    With collaborations, you can extend the reach of your GIS content by seamlessly sharing maps, apps, layers, and more with other organisations. Collaborations are based on a foundation of trust between participating organisations and are typically motivated by common goals and initiatives.

    Two types of collaborations can be established with other organisations: partnered collaborations and distributed collaborations. See below for links to more information on each of these:
    https://doc.arcgis.com/en/arcgis-online/administer/understand-collaborations.htm#ESRI_SECTION1_1FA3EDFCBDBE432AA9EE9B0FB62AB5F8

    https://doc.arcgis.com/en/arcgis-online/administer/understand-collaborations.htm#ESRI_SECTION1_BBEBF7A56A584AA7AF499FA9E318B1C0

    When should I move to ArcGIS Pro?

    Eagle Technology and Esri strongly recommend that you use ArcGIS Pro as the Desktop GIS tool within your organisation as this future-proofs your workflows but allows you to take advantage of many new features and work patterns, especially those which are based on Web GIS such as sharing, collaboration and distributed processing.

    How do I move to ArcGIS Pro if I have third-party extensions that have not yet been ported over to ArcGIS Pro?

    Eagle Technology and Esri are actively working with 3rd party organisations (such as partners and related technology providers) to create ArcGIS pro-compatible versions of their various tools (Add-ins, Extensions, Customisations). However, if there is not an ArcGIS pro version available for a solution which you use today, then you can look at hybrid workflows where you make use of ArcGIS Pro and ArcMap depending upon the specific workflow. We are also keen to learn of any such non-ArcGIS Pro enabled solutions – we may be able to help.

    Should we be migrating Web Apps built in Web App Builder to ArcGIS Experience Builder?

    Web AppBuilder and Experience Builder are not at parity – Web AppBuilder has a number of widgets that Experience Builder does not. However, Experience Builder has much more flexibility around mobile responsiveness, multiple pages, and the increased performance that comes with v4 of the JavaScript API. If Experience builder has the required functionality then upgrading may be valuable (particularly for upgrading classic StoryMaps), but there aren’t currently any plans to deprecate Web AppBuilder.

    What version of LocalMaps has all the new functionality talked about in the ArcGIS Technology Update?

    The LocalMaps update covered the features in the current v2.3.1 version of the software.

    What is the mobile geodatabase?

    A mobile geodatabase is a collection of various types of GIS datasets contained in a single file on disk that can store, query, and manage spatial and nonspatial data. Mobile geodatabases are automatically available to all users of ArcGIS Pro and can be created using a variety of methods. See here for more information: https://pro.arcgis.com/en/pro-app/latest/help/data/geodatabases/manage-mobile-gdb/mobile-geodatabases.htm

    Accessing Premium Imagery Services – how do I do that?

    Please get in contact with your account manager to discuss the different options and services available.

    How do I access the Deep Learning Models / Modules?

    The Deep Learning Models can be found on ArcGIS Living Atlas: http://livingatlas.arcgis.com. Another good reference is the blog that Esri published: https://www.esri.com/arcgis-blog/products/arcgis/announcements/announcing-new-pretrained-models-at-fedgis/

    How can I make our most recent imagery available in the NZ Basemap?

    If you have Imagery that isn’t in the NZ Imagery basemap yet and is newer than the imagery currently available, we are more than happy to add it to the NZ Imagery basemap. Please reach out to livingatlas@eagle.co.nz

    When should we be using ArcGIS Online and when using ArcGIS Enterprise?

    There are many different factors that play a part in answering this question. A good starting point is this document: https://enterprise.arcgis.com/en/portal/latest/administer/windows/choosing-between-an-arcgis-online-subscription-and-portal-for-arcgis.htm

    Feel free to reach out to us to have a more in-depth conversation about this topic.

    Thanks again for being part of and supporting a great community and we look forward to seeing you (maybe even face-to-face!) at other events later this year.

  • A hybrid training course…

    A hybrid training course…

    What is a hybrid training course and why should you attend?

    During 2020 we have developed skills that have enabled us to work solely in the virtual environment. Why not utilise these skills and connect virtually to any face-to-face training course Eagle Technology offers from the comfort of your own office or home?

    Eagle Technology refer to a course where we have learners attending face-to-face and virtually as a hybrid training course. We believe offering hybrid training courses will be especially useful if you or your organisation are travel time and budget poor.


    What does a hybrid training course entail?

    When attending a face-to-face course virtually you will get the same level of interactivity as you would if you were in the physical classroom. You will be able to see and interact with other participants and the instructor throughout the course.

    You will get hands-on practice with ArcGIS software using a virtual machine that is fully loaded with the data and software for your course. The instructor can view and monitor your progress and offer assistance when needed.

    You will be able to download a copy of the course manual in a searchable and editable PDF format which includes the concepts covered in the class, activities, and step-by-step exercise instructions as well as additional references.

    You can also download a copy of the course data to your computers for independent practice at a later date.


    How to register

    Visit the Eagle Technology website to register on a course and simply tick the “I will be attending this course virtually” tick box to let Eagle know you will be attending a face-to-face course virtually.

    Maybe we will see you online attending a hybrid training course soon.


    If you have any further questions about hybrid courses, please don’t hesitate to contact Claire Thurlow, Eagle Technology’s GIS Training and Education Manager.

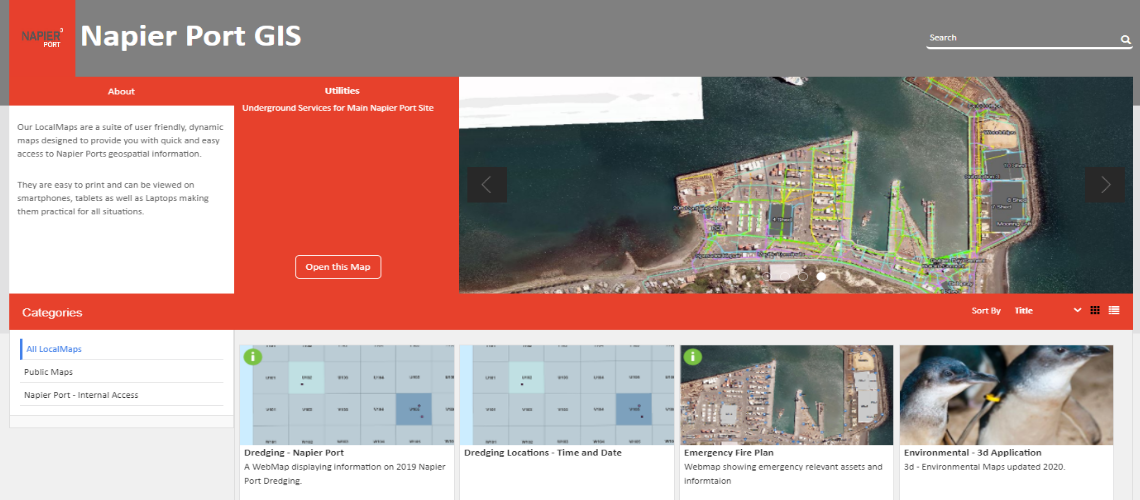
  • Implementing ArcGIS technology puts Napier Port on the map

    Implementing ArcGIS technology puts Napier Port on the map

    Three years ago, Napier Port began to use ArcGIS tools to enhance safety and improve its ability to manage and track its assets. Since then Napier Port has extensively implemented the technology to connect people, locations and data, using interactive intelligent maps.

    Both seaports and airports share many of the same communication, safety and regulatory challenges as small cities or towns. In meeting these challenges, they must successfully manage their infrastructure, environment and community engagement. To do this they fully integrate their parcels: utilities including water, electric, sewer, stormwater and fibre; assets including pavements and buildings; and regulatory requirements such as health and safety, noise control, environment and bio-security. Done well, GIS can support positive engagement with the public, contractors and government agencies.

    Two of Napier Port’s latest projects clearly illustrate the benefits of implementing ArcGIS mapping, tracking and data analysis.

    In mid-February of this year, Napier Port commenced construction of its new 350-metre-long 6 Wharf. Scheduled for completion in 2022, the new wharf is regarded as an important new piece of infrastructure for Hawke’s Bay. It will enable Napier Port to welcome more vessels and to continue improving its operational performance, as well as increasing the region’s connection to the world.

    Napier Port’s Infrastructure ArcGIS/CAD technician, Matthew June, says Collector and Survey123 are already playing a vital role in tracking the construction progress.

    “For example, we will inspect piles for progress as well as compliance. The data collected onsite is then sent directly into ArcGIS Online and shared with those who need the information,” Matthew says.

    Maps containing both 2D and 3D datasets can be combined to tell a complete story, as well as to reveal otherwise invisible infrastructure.

     
    Often simplicity can rule the day, Esri’s QuickCapture is proving to be a very simple app providing big results.

    Port staff can quickly record field observations via cell phone or tablet as they inspect the progress on the new wharf. The data is instantly sent back to the office for real-time analysis, other tools then provide easy access to edit associated data. The photos are then viewed on a timeline giving a historical documentation of the situation on the ground. As the name implies this is a quick process that removes the need for hand-written notes or processing of photographs.  

    “It’s enabled us to carry out our due diligence by tracking the history and the progress of building the new wharf,” Matthew says..

    The second initiative focuses on providing a safer, more efficient environment for those who work on and visit Napier Port.

    “It is, for all practical purposes a data integration campaign, giving Napier Port the ability to visualise both spatial and temporal data. We will be analysing near real-time data to identify conflicts not previously seen when good data is stove-piped into a single program,” he says.

    “Our goal is that a ship visit is no longer just a schedule of the ships’ time in port but an integrated analysis of requirements to keep cargo moving, people safe and support the infrastructure needed to make it all happen.”