Author: eagle_managewp

  • LocalMaps 2.0 is here!

    LocalMaps 2.0 is here!

    As our major release for the year, 2.0 is filled to the brim with new features, greater administration capabilities and various UI enhancements. Scroll down to see some of the key updates.

    NOTE: the below is an overview of key features in this release. Head to our LocalMaps Community page to see the full release notes and resolved issues list for Version 2.0. https://community.esri.com/groups/localmaps-nz 

    Viewer

    With Version 2.0 we have enhanced several of the existing widgets, brought in the Add Data widget and in some cases updated widgets with Esri’s OOTB tools.

    Widget updates:

    Select

    Updated to Esri’s OOTB Select tool however, administrators can now additionally enable Advanced Select tools for selection by attribute and / or feature.

    Draw / Measure

    Leveraging the best of both tools, LocalMaps has combined the OOTB Esri Draw and Measure widgets into one powerful tool. Users now have interactive measurements shown whilst tracing line/shape, the option to include bearing measurements, a fixed radius and line segment lengths.

    Zoom to Point

    Capture and convert coordinates – NZTM, NZMG, WGS84

    Switch Map

    Filter map to switch to using tags or titles

    Basemap & Share widgets

    Updated to Esri OOTB

    NEW – Add data

    Add data from an ArcGIS online group, file or UR

    NEW – Widget Help
    Users can now see step by step how to use a widget in LocalMaps by clicking the info icon located in the top right of the widget header.

    Coming soon! Check out the Eagle Youtube Channel for full “how-to” video for LocalMaps Widgets.

    LocalMaps Theme for Web AppBuilder

    This release now includes a new LocalMaps Custom theme for Web AppBuilder for ArcGIS. This gives organizations the flexibility to build their own Web Apps, bring in specific widgets outside of the core LocalMaps widgets while maintaining the consistent styling of the LocalMaps viewer.

    Head to the LocalMaps Community page to find out how to build your own LocalMap with Web AppBuilder

    Administration

    The LocalMaps administration tools continue to grow giving you even greater flexibility when configuring your LocalMaps site. Below are some of the key new tools and enhancements.

    NEW sections:

    Hilltop

    Hilltop software is used in New Zealand by regional councils, electricity companies and consulting engineers for storing and analyzing environmental data. The new Hilltop section in LocalMaps allows you to pull data from Hilltop Server and create a new hosted feature layer to view and query in your webmaps and web applications.

    Feature Queries

    LocalMaps Feature Queries give you the ability to view additional information about a property that doesn’t exist on the layer itself. Essentially, you are creating a related record on the fly and then displaying this information in a layer’s popup.

    Analytics

    This section lets you quickly and simply see how people are using LocalMaps, what maps are most popular, what widgets are most popular and who are your heavy users.

    Reporting

    • Dynamic text reports
      • Dynamic text reports allow you to use placeholders with specific syntax that the LocalMaps reporting engine understands. When a report is then generated, LocalMaps will replace your placeholders with real values and give you a nice printable document back. 
    • Datasources
      • Add SQL or Oracle Databases
      • Add Hilltop Servers
    • Maps & Apps (Previously Maps tab)
      • Web apps can now be feature maps too
      • Click on Map thumbnail to launch viewer directly from Admin
      • Assign a Widget to open on map launch
      • Order how widgets appear in the map toolbar
      • Set map to be default e.g. the viewer URL will go to this
      • Enable the Advanced Select Widget

    Watch and learn

    Coming soon! Keep an eye on the Eagle Technology Youtube Channel for full “how-to” video for the LocalMaps Viewer and Administration .

    The LocalMaps Team – Dec 2017
  • Inspire Fascination, Invoke Curiosity, and Spark Interest

    Inspire Fascination, Invoke Curiosity, and Spark Interest

    Claire Thurlow – GIS Training and Education Manager

    Let’s plan together for the future of our industry.

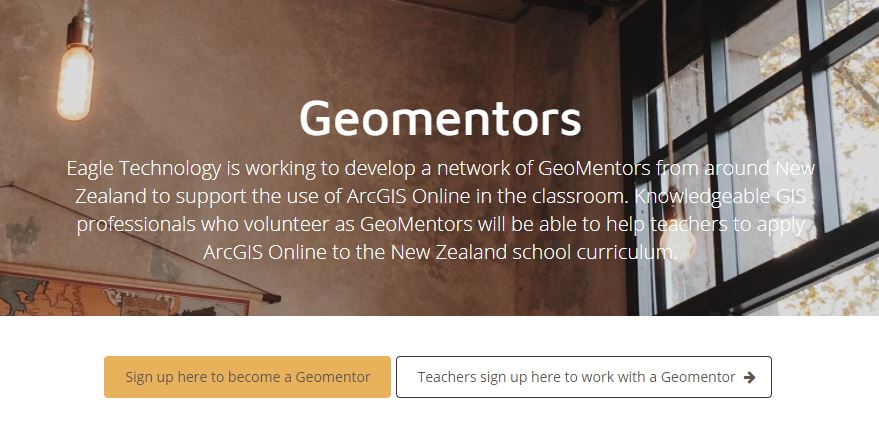
    Eagle Technology has formalised the Geomentoring GIS in Schools program for New Zealand. This means as a GIS Professional you can register at http://www.eagle.co.nz/geomentors to Inspire Fascination, Invoke Curiosity, and Spark Interest in the Geospatial Industry in youngsters attending your local school.

    When you register to become a Geomentor you will be working with Eagle Technology to develop a network of GIS Professionals from around New Zealand to support the use of ArcGIS Online in the New Zealand classroom. You, as a knowledgeable GIS professionals, will be volunteering to help teachers to apply ArcGIS Online to the New Zealand school curriculum.

    To start with, it would be a good idea to explore, the curriculum-aligned lesson plans available on the Eagle Technology’s Instructional Materials website. You might also like to get your head around the year system that schools now utilise in New Zealand and the basics of NCEA!

    Please note: To become a Geomentor in New Zealand you will need to be over the age of 18.

    For more information visit our geomentors page or contact gisinschools@eagle.co.nz

  • Behind the Scenes of Election17

    Behind the Scenes of Election17

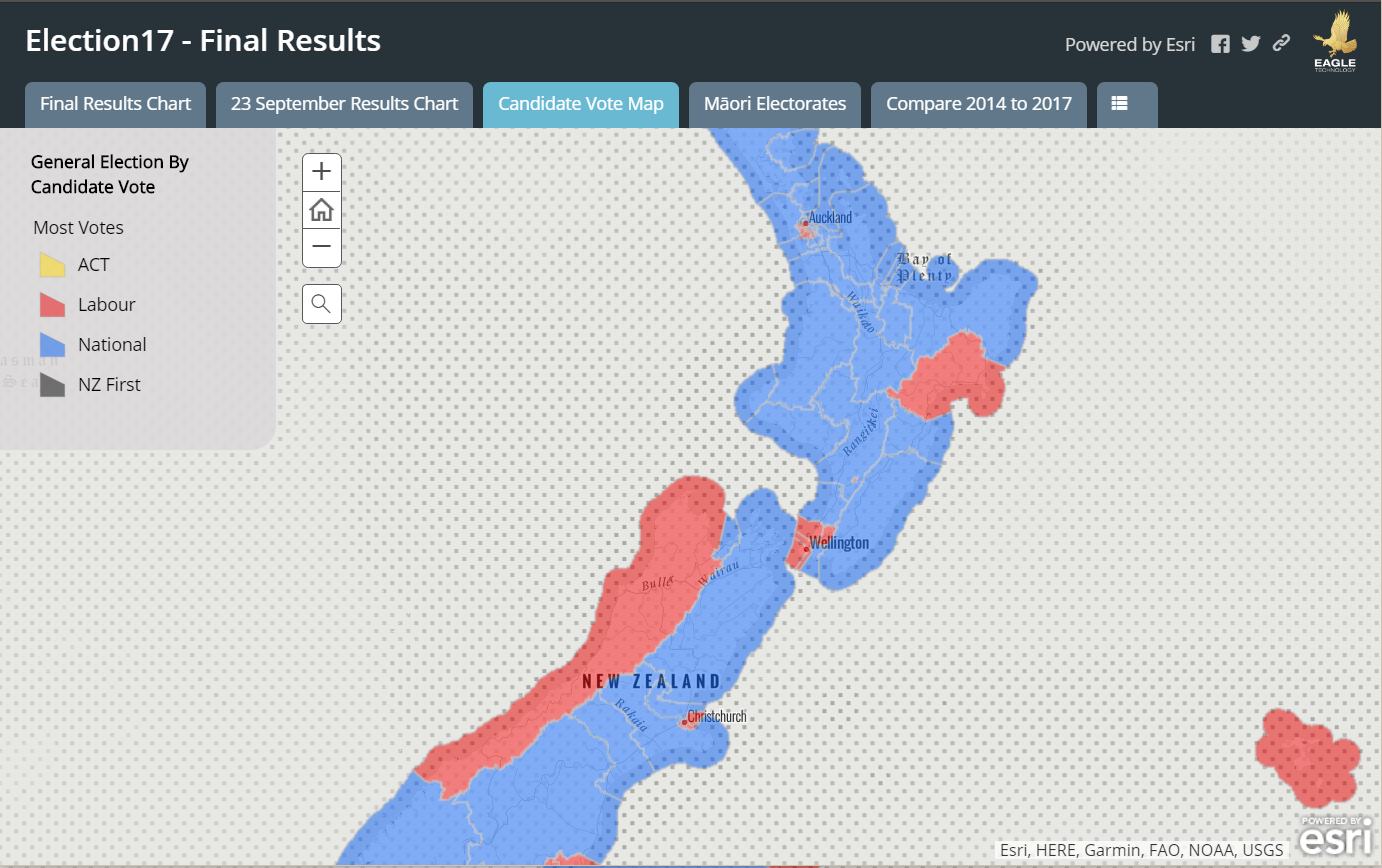
    This year Eagle Technology partnered with Radio New Zealand for the Election17 coverage, producing their live-updating election maps on the night. This blog post will reveal the technical tips and tricks behind how these maps were made.

    What we had to work with? The Electoral Commission released their results for the 2017 Election publicly in xml format.

    So how do we take this data and transform it into colour changing and winner naming maps?

    To do this we used a combination of FME, ArcGIS online and arcade expressions. These were used for the following workflow;

    XML to ArcGIS Online hosted feature layer

    The election results were available to us in xml. FME was used to convert this xml feed into two ArcGIS Online Hosted Feature Layers (Polygons of the General Electorates, and Māori Electorates) and an ArcGIS Online table.

    From these Feature Layers we could create various Web Maps and Web Apps on ArcGIS Online. The main product on the night was a Storymap which included a graph of the live party votes for all electorates and main centres.

    Arcade Expressions

    Arcade is the secret behind what made our maps perform and appear well on the night. This language was used throughout for the customization of the popups and symbology of the electorates. Examples of some tasks arcade allowed us to do were;

    • Calculate which party or candidate was currently in the lead 
    • Make the popup show the name of the winning party in their party colour
    • Control what candidates show up for an electorate in the popup
    • Show the winning margin between candidates
    • Show the 2nd Place Candidate

    Learnings from this experience

    • When editing symbology on a hosted feature layer which has multiple feature layer views originating from it. try to get the symbology, popups and arcade done on the original feature layer prior to making the views (this will reduce a lot of repetitive tweaking on layers).
    • Having important details like colour hexcodes on standby is really useful for the amount of times you have to copy and paste!
    • Take care while creating maps with feature views . Do not “Save Layer” and over write the layer settings (i.e.symbology and for a brief monent make the whole map purple. Creating a new view for this sort of testing is advised as best practice.

    Overall this was an incredible opportunity for the Interns to use our knowledge gained over the last few months, and work on a high-profile project alongside other members of the Eagle Technology Technical Team.

    Our storymaps from the night are still live (with special votes), and can be viewed here: http://eaglegis.maps.arcgis.com/apps/MapSeries/index.html?appid=bfe1903e…

  • Wellington – Teachers upskill in ArcGIS

    Wellington – Teachers upskill in ArcGIS

    Claire Thurlow – GIS Training and Education Manager

    On 27 October, it was a privilege to host 11 teachers from around New Zealand (but mostly Wellington) at Eagle Technology House. The day was dedicated to enabling the teachers to upskill in ArcGIS Online. There were seven schools represented in the room and in some cases there were multiple teachers from a school attending.

    Most of the schools represented on this training were exploring options for introducing GIS into their classrooms in 2018. So we started out simple and all the teachers created some map notes on a web map reflecting the tasks set out in the ArcGIS Online basics – Editing school lesson. We then expanded to adding layers from ArcGIS Online to the map for example the New Zealand Deprivation Index layer. This layer always generates a good discussion about why certain areas, such as the CBD in Wellington, appear as deprived in the map!

    We then took a stroll through Story Maps (both worldwide and local) and Geoinquiries localised to the New Zealand school curriculum that are available at http://www.eagle.co.nz/gis-schools. Then we plunged into the NCEA level 1,2 and 3 resources available on the GIS in Schools website

    NCEA Level 1
    NCEA Level 2
    NCEA Level 3

    This generated some interesting discussions about other topics that could have lessons developed around them. These topics ranged over the following topics:

    • sustainability topics,
    • the use of GIS in conservation
    • freedom camping
    • water quality
    • zombie attacks
    • sports related topics
    • snow / glacier melt – climate change 

    Давайте познакомимся с самой крупной на Земле (а точнее в воде) рыбой - китовой акулой. Сколько весит и живет китовая акула смотрите по ссылке.

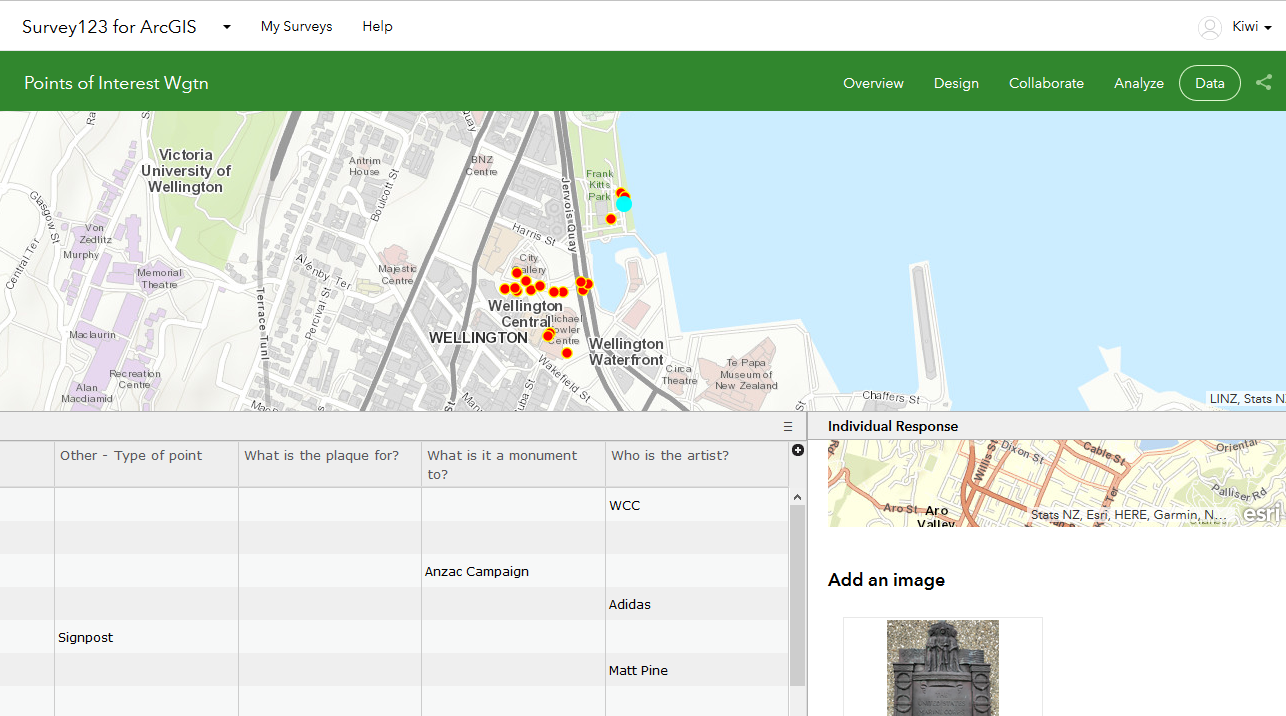
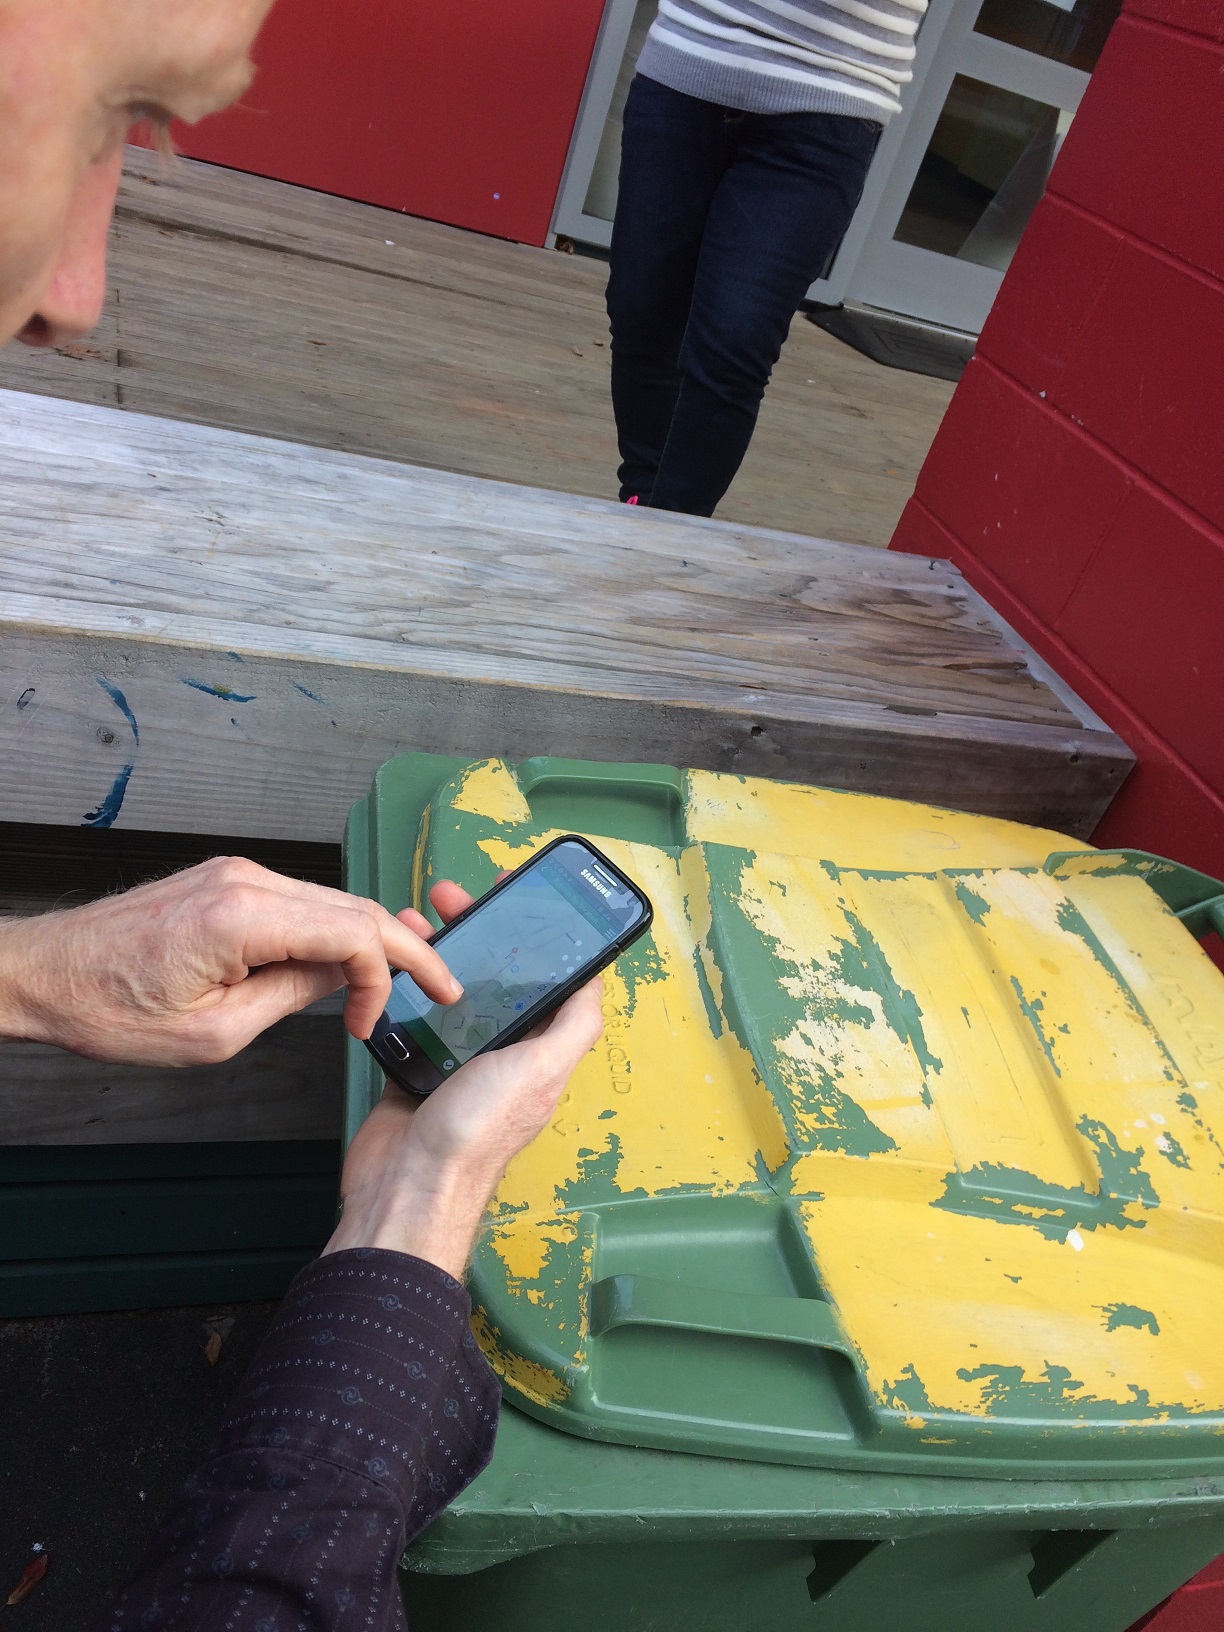
    Late in the afternoon we broke out Survey123 for ArcGIS – available with a schools ArcGIS Online account. We created a simple survey that enabled us to artwork, plaque and monument locations in Civic square and the Wellington Waterfront. We then took our devices out into the stunning Wellington sunlight to capture some data. You can see a view of some of the data we captured at the top of this blog. I think the data quality issue might come up again in the classroom after capturing data in the field!

    All in all a very successful day and Eagle looks forward to hearing the success stories that come out of the classroom.

    #NZGISinSchools

  • Esri User Conference Experience 2017

    Esri User Conference Experience 2017

    Leigh McKenzie – University of Otago and NZ Esri Young Scholar Award Winner 2017

    What could be better than being surrounded by maps? Most people seem to have some kind of childish nostalgia for maps. They hold so much wonder and now they can provide so many answers. I was lucky enough to be part of a project which involved mapping the community of greater south Dunedin for what and who are most vulnerable to sea level rise. This project led me to receiving the New Zealand Esri Young Scholar Award for 2017!

    Being an Esri Young Scholar came with the privilege of attending the Esri User’s Conference in sunny San Diego, with flights, registration, and accommodation generously covered by Esri and the Eagle team in New Zealand. Anticipation was at an all-time high when I reached the Dunedin airport. I was so excited to be surrounded by people who were all into maps! A week long get-together for map nerds.

    Twenty other students from around the world also received the same award which led to close friendships and entertaining happenings throughout the week. Some events were held especially for young attendees, and even just for the young scholars which were always a great time. I already miss the close friends I made while away.

    The conference had 17980 attendees representing 136 countries. The majority of people attending were well into their GIS careers which gave me insight into options, how GIS works in the workplace, its implementation, and huge depth of the field. It also meant that young people stood out in the crowd a little bit, perhaps inviting curiosity from people who would ask how you came to be at the conference. Student speakers were inspiring, as they made me wonder about what projects I could take on myself. This will now become an opportunity for many more as Esri is creating a ‘GIS in Schools’ programme to make it more accessible to a younger cohort.

    The vast range of events gave a lot of mingling and networking opportunities. There were sessions of different scales and types including seminars, learning labs, and practical tutorials. The sessions were inspiring, surprising, and opened my view of what is out there in the GIS realm, and even work being done around the world along the same lines as my own, but on the next level. I was absolutely fizzing with so much to learn, so many options, people to meet, and friends to make. The first hour of the conference had 54 different events you could attend! Luckily the technology savvy Esri team had created an app for the conference agenda so that you could see what was on for the day, save events to your own calendar, and create your own agenda. It was difficult to choose sessions, but I quickly realised you just have to choose ones, go for it, and don’t look back. At the very end of each day I would spend half an hour in bed going through the sessions and planning my next day.

    The conference ran as smooth as silk, incredible for such an immense event. By the end of the first day I was already feeling relieved but totally daunted by the coming week, however the majority of big unknowns were answered. Also, I had been lucky to bump into other Esri Young Scholars early in the first day. Being some of the youngest attendees meant it was easier to spot each other. This was a great start as it meant we were able to form a small team and find our way around together. It was a relief to have a group as we quickly became each other’s support network. Lots of socialising, planning, learning, and networking for the whole coming week!

    The conference gave me ideas for new career paths and made me aware of many more internships, organisations, and applications in GIS. A lot of serious learning and thought provoking discussions, but also, events such as the Young Persons Network Pool Party gave the week a whole dimension of fun and sophistication. The pool party was full of swag, it was suave, swish, sophisticated, and still young and busy. The party at Balboa Park was another level, it felt more like a fantasy than real life. Bands playing in museums, giant games in terraces, banquets in courtyards, salsa dancing by the fountain, all in a perfect, warm, ink blue evening.

    I had so much anticipation for the Esri User Conference, I was excited to be surrounded by people who were passionate about maps, be able to learn more about Esri and GIS, and explore a gallery of 300 maps. However, the conference in San Diego was so much more than I ever could have made-up. This was a once in a lifetime celebration of maps and problem solving that I will never forget. This conference has provided me with so many answers and given me so much more wonder as well. Thanking the Esri and Eagle team could never be great enough for this experience and their immense support.

  • My first 2 weeks at Eagle: Ed Cook

    My first 2 weeks at Eagle: Ed Cook

    Hi there, I’m Ed and I’m one of three interns this year at Eagle Technology.

    My first two weeks here have been spent getting my bearings across the many features within the Esri Software Suite. The other interns Danielle and Errin, and the wider Eagle Team have helped me to further develop my technical skills already, and I look forward to learning as much as I can in these next few months.

    The opportunity to use Esri’s different web and field apps for projects individually, and collectively as workflows has been eye-opening to the potential of the where the software can be applied.

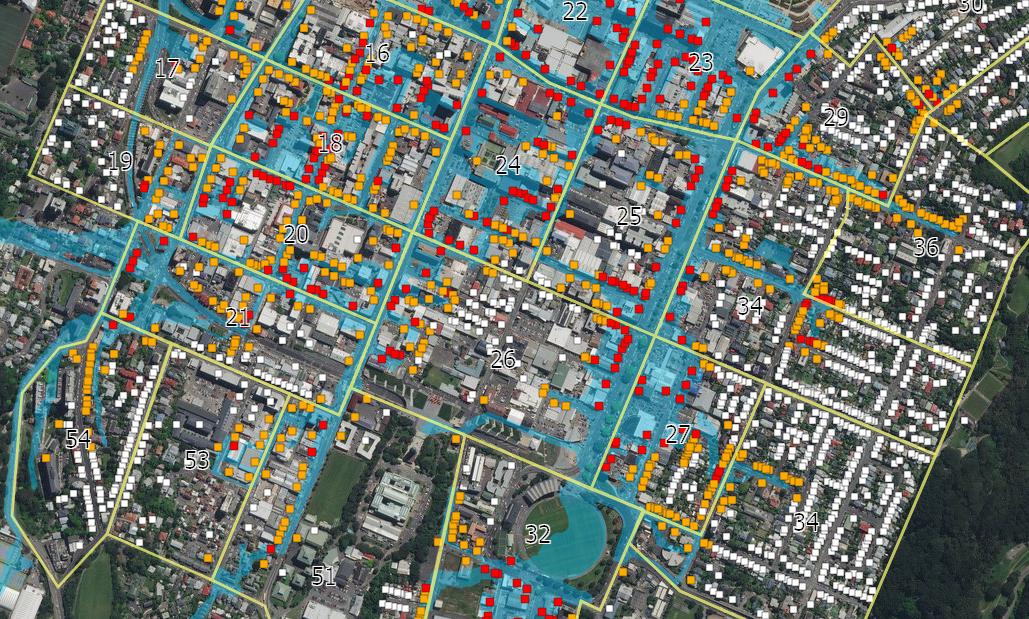
    Already these new skills are being applied to interesting uses. One of the projects I’m currently working on is a workflow for Civil Defence and Emergency Management (CDEM). The scope of this work is streamlining the post-event Rapid Building Assessment process using the Workforce/ Survey123 Field Apps, Operations Dashboard and ArcGIS Pro. Below you can see a Survey123 Form on the left showing address validated assignment zones, and on the right an Operations Dashboard showing real-time results of the survey (with exercise data) for a severe flooding scenario in Central Wellington.

    A demonstration of how this all works and more will be unveiled at NZEUC next month so stay tuned…

  • Dunedin – Teachers upskill in ArcGIS

    Dunedin – Teachers upskill in ArcGIS

    Claire Thurlow – GIS Training and Education Manager

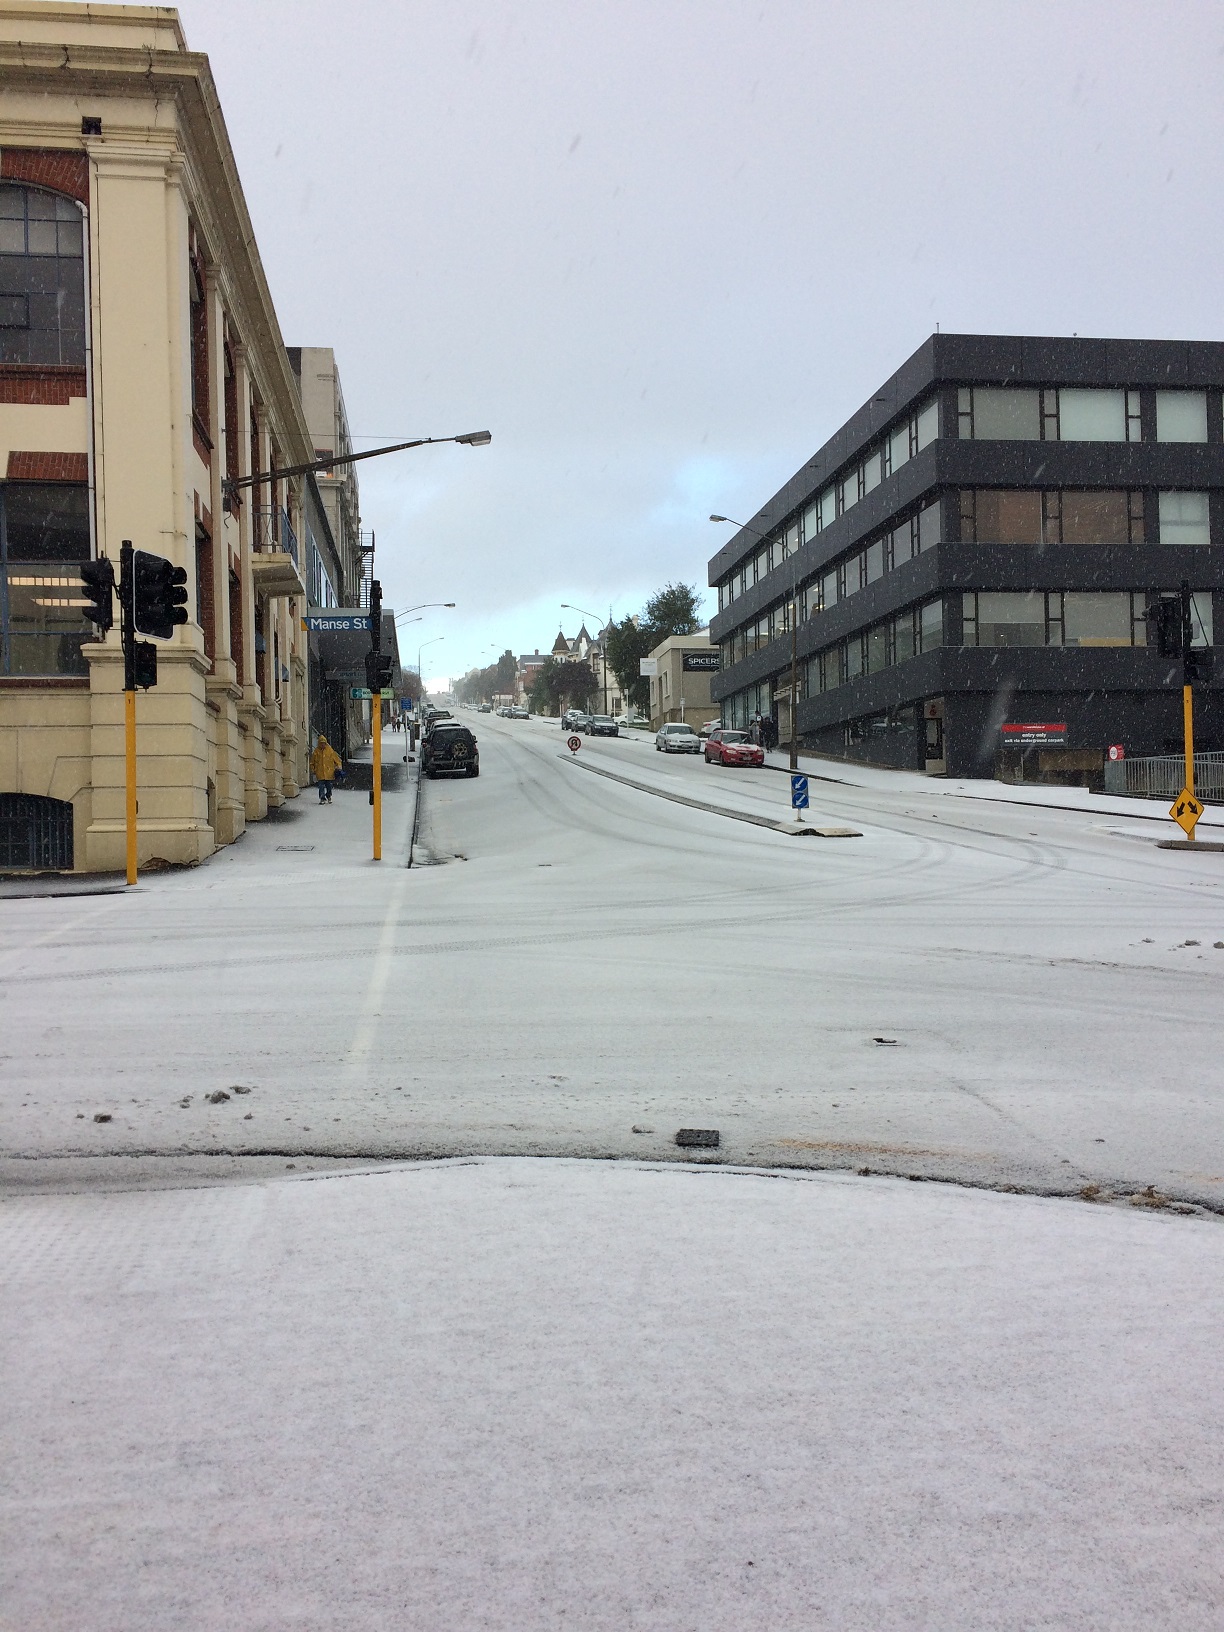
    Through snow, hail and ice they came to learn more about GIS and how to utilise GIS in the classroom.

    It was an absolute privilege to spend two days at Kaikorai Valley College helping teachers from throughout Dunedin expand their skills in the use of GIS in the classroom.

    At the start of the first day the teacher’s knowledge of GIS ranged from not knowing exactly what GIS was to teachers who had worked with primary school children and Collector for ArcGIS to capture data for mapping purposes on the Kaikorai Valley College urban farm.

    By the end of the first day all the teachers knew the following:

    We took Collector for ArcGIS out and about the school on the first day which posed some interesting challenges considering there was snow and ice on the ground! It also identified some real learnings about spatial data capture and data quality.

    The second day focused specifically on helping the staff at Kaikorai Valley College create a lesson that they could use in Geography at NCEA level 2 and 3. This lesson was based on the geolocated elemental breakdown of soil data captured by Simon Cox from GNS Science in 2016 on the Kaikorai Valley College urban farm. In the lesson students will

    • manipulate the data so it can be added into an ArcGIS Online Web Map (each student will have one or two different elements to display in a map)
    • run a query / filter on the data so that their map shows only those points that are within safe boundaries for farming
    • change the symbology of the map to better represent any patterns they see in the data
    • describe the pattern that they see
    • explain why an area might be good or not for planting a particular plant or housing a particular animal – solving a geographic problem
    • try and represent the points as a surface by using the ArcGIS Online Analysis tools – challenge for more advanced students.

    A big thanks to Simon McMillian for organising this event despite the weather challenges and to representatives from GNS Science and the University of Otago Surveying School who added their knowledge and skill to the first day.

    Lessons learnt

    • Having a class suite of smart devices to enable data capture in the field using Esri products is a fantastic idea.
    • Getting your Science department involved with GIS brings a whole new dimension to GIS in your School – cross curriculum GIS activities are an extremely rich learning environment.
    • If teachers are committed to expanding their knowledge to further the tools they have in their teacher toolbox they will come!
    • Maybe winter in Dunedin is not a great time to schedule a teaching training event which has an outside component!

    #NZGISinSchools

  • Tauranga – Teachers upskilling in ArcGIS

    Tauranga – Teachers upskilling in ArcGIS

    Claire Thurlow – GIS Training and Education Manager

    On 28 June it was an absolute privilege to travel to Tauranga and assist a number of teachers in the Bay of Plenty area to upskill in ArcGIS Online. There were five schools represented in the room and in most cases there were several teachers from each school attending.

    We started the day off with a round table discussion about where people had got to in implementing GIS in their classrooms. Many were in the same boat they wanted to use GIS in the classroom but didn’t know where to start.

    This sentiment guided the day. We started out simple and all the teachers created some map notes on a WebMap reflecting the tasks set out in the ArcGIS Online basics – Editing school lesson. We then expanded to adding layers from ArcGIS Online to the map for example the New Zealand Deprivation Index layer. This layer generated some good discussion around the meaning of data and other geographic concepts you could teach around GIS and spatial data.

    Once the teachers had saved their maps we progressed to look at some of the geoinquiries localised to the New Zealand school curriculum that are available http://www.eagle.co.nz/gis-schools. We also explored the new Maths geoinquiries just released by Esri for the benefit of our sole Mathematics teacher in the room. This lead naturally into a discussion on NCEA level 1,2 and 3 resources available on the GIS in Schools website

    We then ramped it up a notch and broke out Survey123 for ArcGIS – available with a schools ArcGIS Online account. We created a simple survey that enabled us to capture rubbish bin locations around the school and then we took our devices to the field to capture some data. Once the teachers got the hang of capturing data in the Survey123 App they were off capturing rubbish bin locations…when we returned to the room we explored our data capture results and discussed how Survey123 for ArcGIS could be used in their teaching. Some ideas were:

    • Capturing Graffiti locations, including a picture, around a city and analysing the results for urban patterns achievement standards
    • Capturing litter locations on the Tongariro Alpine Crossing as part of the large natural environments achievement standards
    • Connecting to the Digital Technologies curriculum
    • Using Survey123 as a tool to help inspire learning especially in the Geography lesson that is last thing in the day on a Thursday or Friday.

    All in all a very successful day and we look forward to hearing the success stories that come out of the classroom!

    Thank you to Bay of Plenty In-Service Training (BIST) for organising / sponsoring the day and Otumoetai College for hosting us all.

    #NZGISinSchools

  • NZ Esri Young Scholar Award 2017 – Excellent submissions

    NZ Esri Young Scholar Award 2017 – Excellent submissions

    We have had some excellent submission for the NZ Esri Young Scholar Award in 2017. Take a peek at some of the submissions, in no particular order.

    Evaluating the magnitude and spatial extent of disruptions across interdependent infrastructure – Conrad Zorn

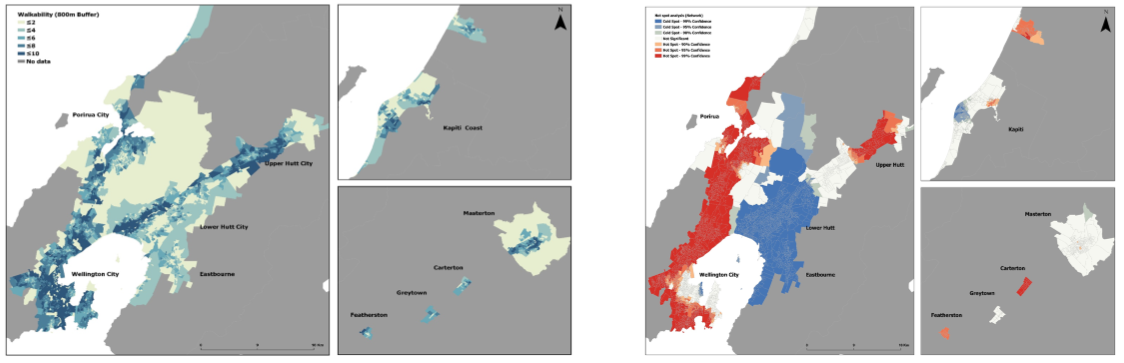
    Walking to scale: Utilising ArcGIS to implement a residential scale walkability index in Auckland, New Zealand – Euan Forsyth

    A GIS-based risk assessment of coastal archaeological sites in Otago, New Zealand – Greg Hill

    Quantifying morphologic changes of a coastal foredune using low-cost remotely piloted aerial system (RPAS) – Julia Moloney

    Using a Geodatabase to Assess Vulnerability to Sea Level Rise in Greater South Dunedin – Leigh McKenzie

    Potential Forestry Location in the Bay of Plenty – Robyn O’Brien

    Lightning Strike Prediction – Protecting Critical Assets – Stephen Ford

    The winning submission – to be announced shortly – will see a young scholar flying across the sea (on the trip of a life time) to San Diego to attend the Esri User Conference in 2017

  • Hello my Name is Errin!

    Hello my Name is Errin!

    Hi there – I am intern number 2 (of 3) at Eagle Technology this year and I believe that just like the Godfather Movies the 2nd is the best. Over the past 2 weeks I have been up to a lot of learn, fun and exploring both in GIS industry and in the workplace. So far I may have the makings of an ArcGIS Online expert learning the analysis tools and Earthquakes in Nepal.

    I also used ArcGIS Pro for the first time using the 3D features to explore earthquakes and building damage in San Fernando Valley. 3D always captivates the mind, its such a good way to visualize data and get your head around what factors are spatially influencing your subject area.

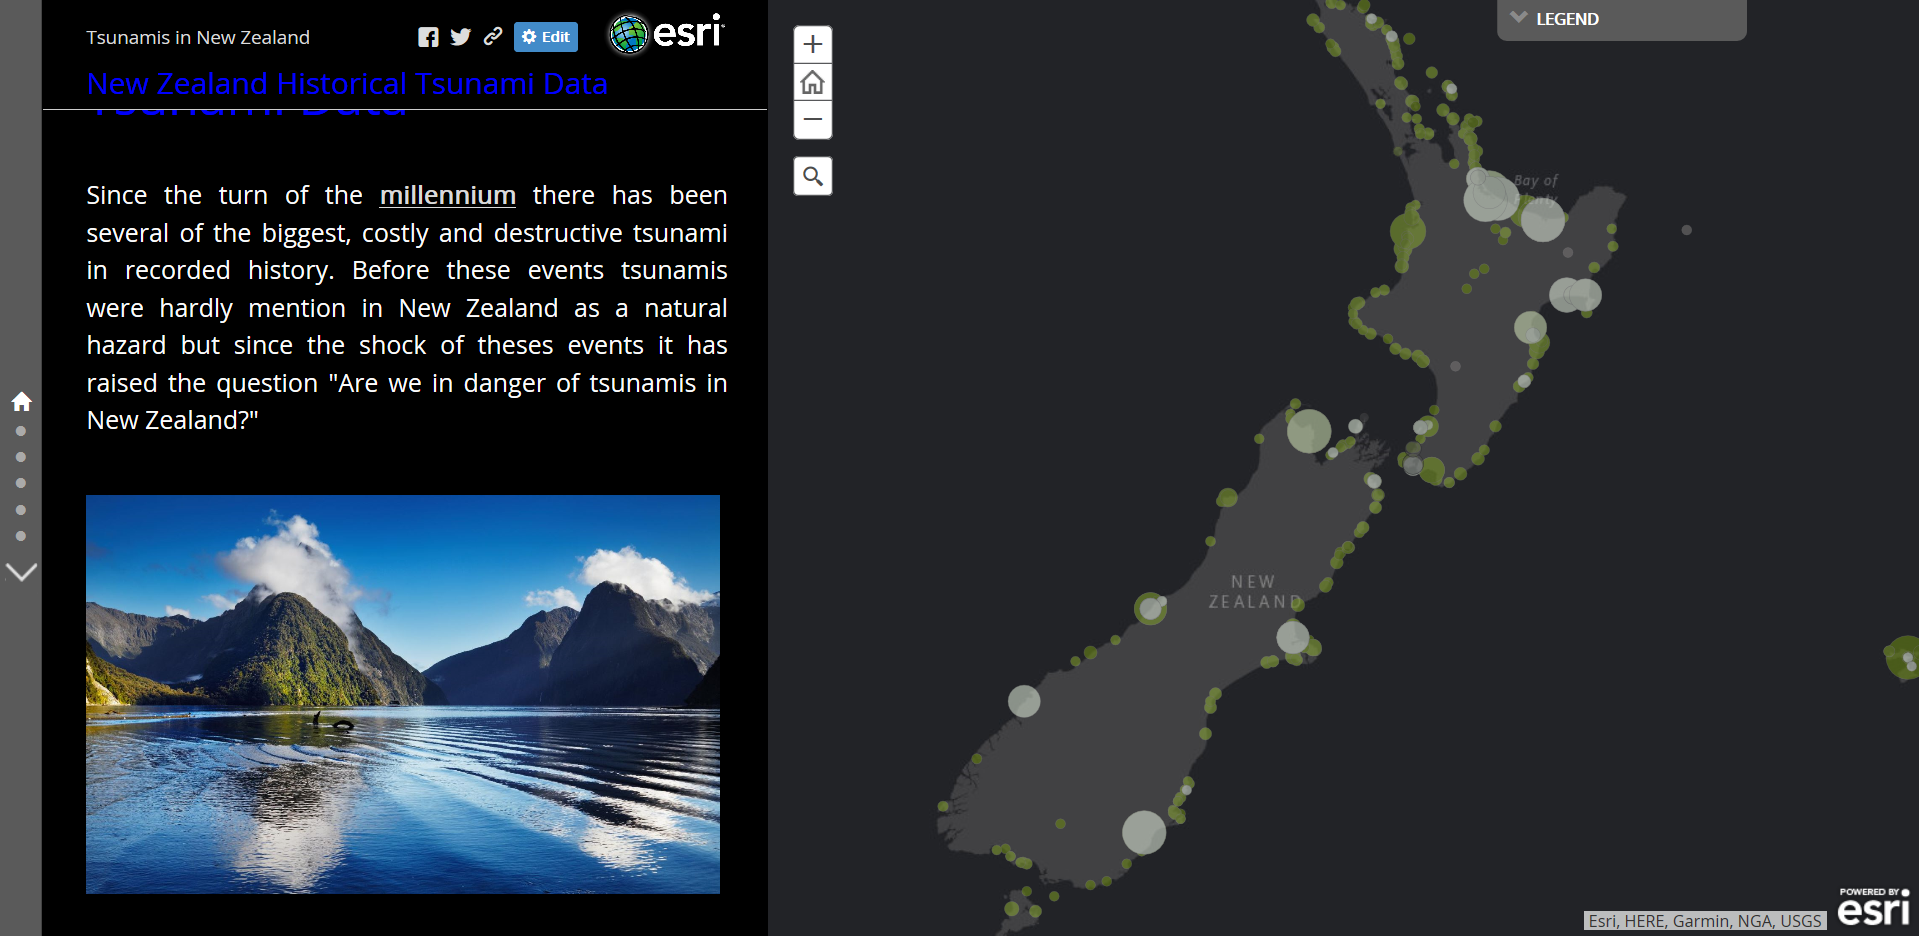
    With NIWA releasing  a new paleo-tsunami database I created by first Story Map aimed at explaining the dangers  that  tsunamis pose to New Zealand but are rarely acted upon. The story maps looks at paleo-tsunami evidence sites around the country and what potential damage could occur in a large tsunami event. The Story map and can viewed here
     

    So far working at Eagle has been fun learning experience with such a good group welcoming me to the team I can’t wait to find what else I get up to and looking forward to seeing you all face to face the at NZEUC!!

    Errin Rowan.